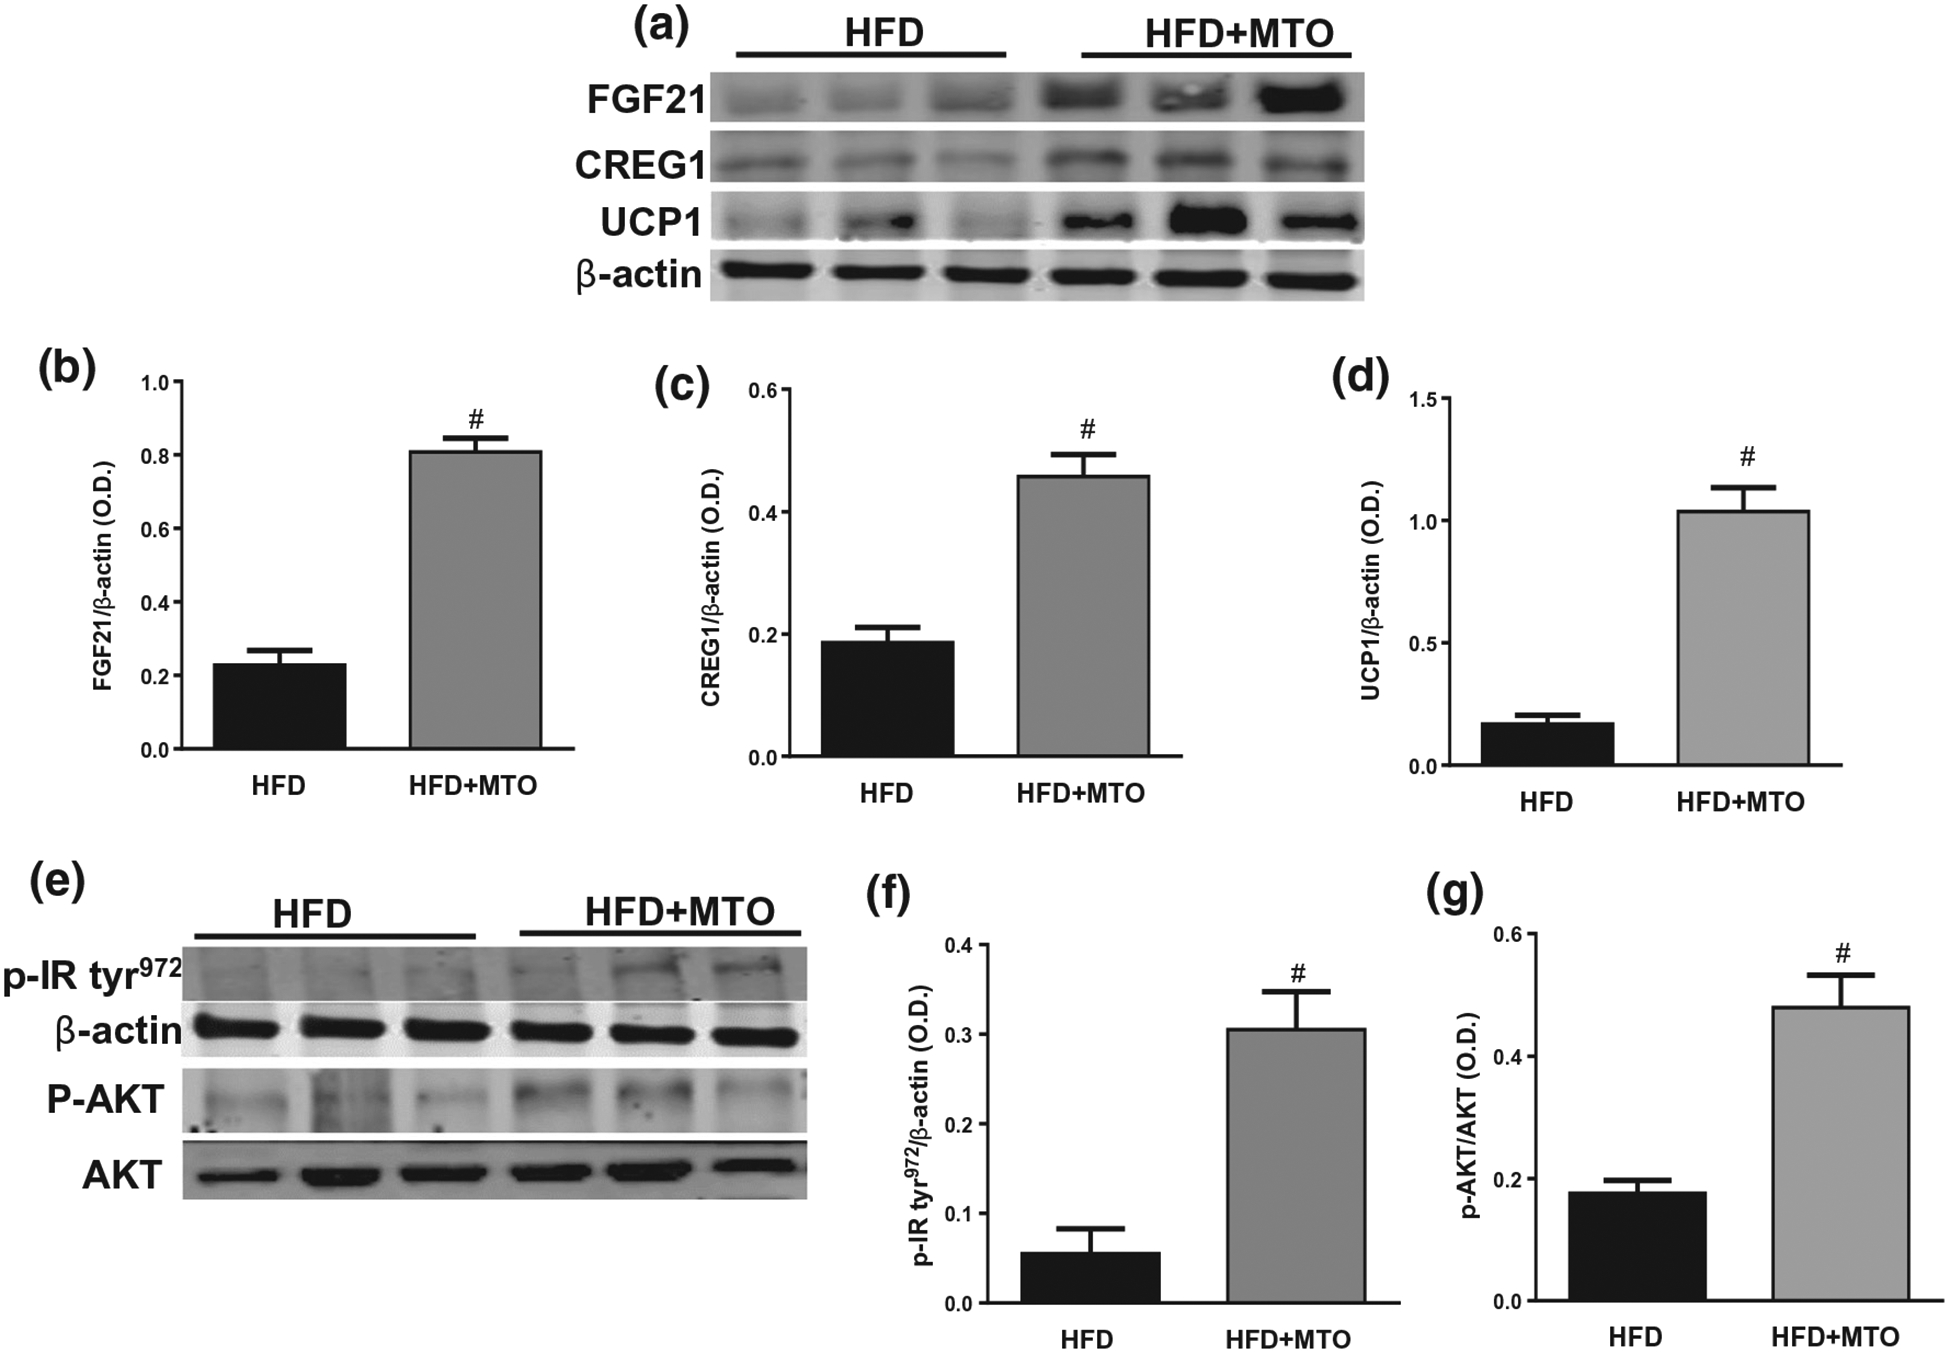
FIGURE 7.

Adipose tissue levels of fibroblast growth factor-21 (FGF21), Cellular Repressor of E1A-stimulated Genes 1 (CREG1), uncoupling protein-1 (UCP1), and phosphorylated tyrosine 972 insulin receptor (p-IRTyr−972) normalized to β-actin and levels of phosphorylated and total AKT. (a) Representative Western blots, (b) Adipose levels of FGF21 (c) Adipose levels of CREG1, (d) Adipose levels of UCP1, (e) Representative Western blots, (f) Adipose levels of p-IRTyr−972, (g) Adipose levels of pAKT/AKT. #p < .05 as compared to HFD. n = 6/group
