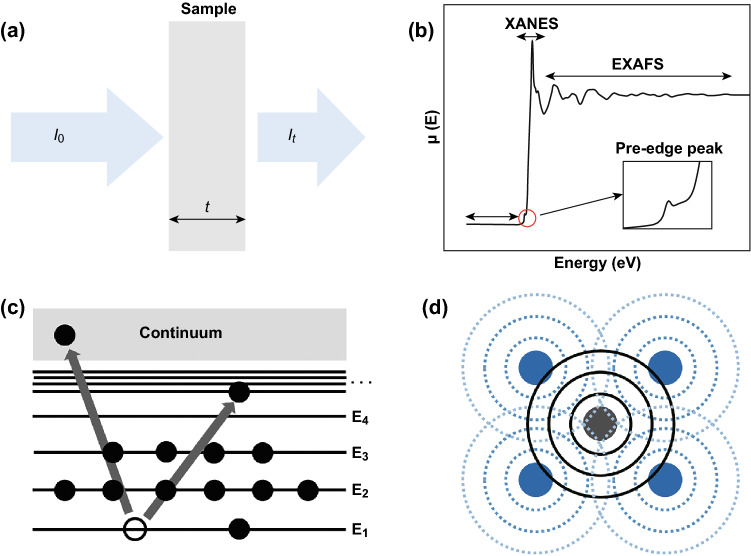
Fig. 1.
a Schematic of incident and transmitted X-ray beam. b Schematic of XAS including the pre-edge, XANES, and EXAFS regions. c Schematic of the X-ray absorption process and electron excited process, the black circle is electrons. d Schematic of interference pattern creating by the outgoing (solid black lines) and reflected (dashed blue lines) photoelectron waves between absorbing atom (gray) and its nearest atoms (purple). (Color figure online)

