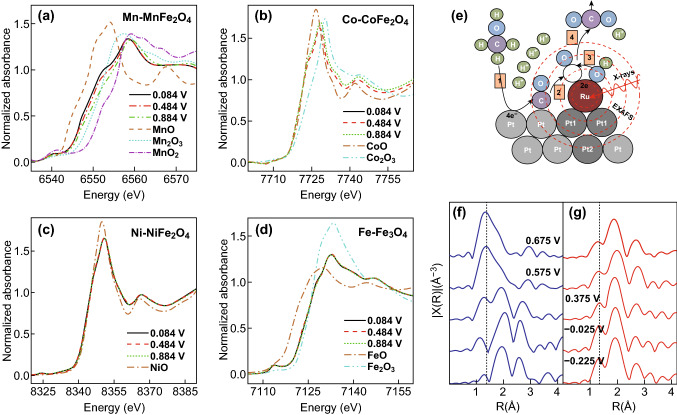
Fig. 8.
K-edge XANES spectra of a Mn in MnFe2O4, b Co in CoFe2O4, c Ni in NiFe2O4, and d Fe in Fe3O4 under various applied potentials. Reprinted with permission from Ref. [37]. e Schematic of the surface reaction of the Ru atoms. R-space graphs as a function of applied potential f without (blue) and g with (red) CH3OH. Dotted line placed at ca. 1.4 Å signifying a reference point for the oxygen peaks. Reprinted with permission from Ref. [82]. (Color figure online)

