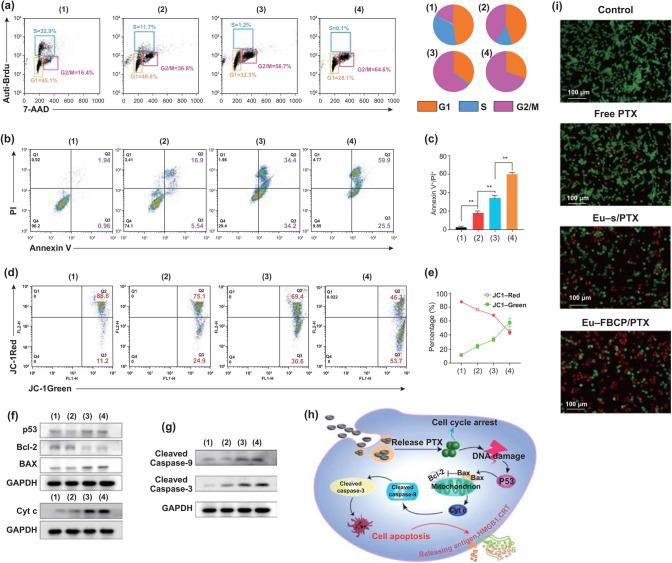
Fig. 4.
In vitro cell cycle and apoptotic analyses for MC-38 cells treated with different configurations (1: control, 2: free PTX, 3: Eu-s/PTX, and 4: Eu-FBCP/PTX). a Cell cycle analysis results from the different treatments (1–4). Brdu and PI were used to calculate the cell fractions for each phase (G1, S, or G2/M) in the cell cycle. b, c Apoptotic profiles and the quantified data from the 24 h treatments (1–4) using Annexin V-FITC/PI kit (n = 3). d, e FACS profiles and the quantified data from JC-1 staining exhibiting changes in mitochondrial membrane potential for the 24 h-treated (1–4) cells (n = 3). f, g Representative expression of p53, Bcl-2, Bax, Cyt c, cleaved caspase-9, and cleaved caspase-3 in the treated cells (1–4). h Schematic of a plausible mechanism for the apoptosis in the treated cells (1–4) based on the expression (f, g). i Representative microscopic AO/PI-stained cell images from live/dead assay with the treatments (1–4)

