Fig. 5.
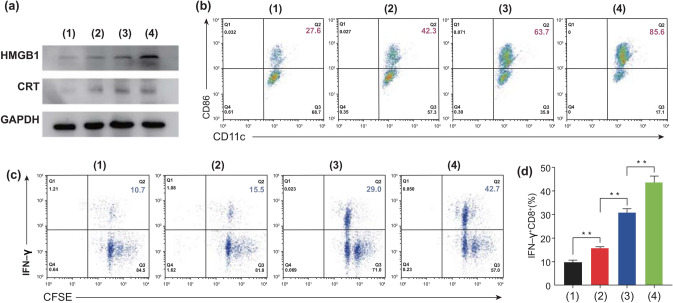
In vitro bioassays for MC-38 cells to examine ICD-induced DC maturation and CD8+ T cell activation from different treatments (1: control, 2: free PTX, 3: Eu-s/PTX, and 4: Eu-FBCP/PTX). a Representative expression of HMGB1 and CRT from the treatments (1–4), indicating the induction of ICD. b CD11c+–CD86+ (as indicators of DC maturation) plots to identify maturation of the DCs by exposure to TAA generated from the treated cells (1–4). c CFSE–IFN-γ plots to determine the proliferation and activation of CD8+ T cells. d Fractions of activated IFN-γ+CD8+ T cells from the treatments (1–4) (n = 3; **p < 0.01)

