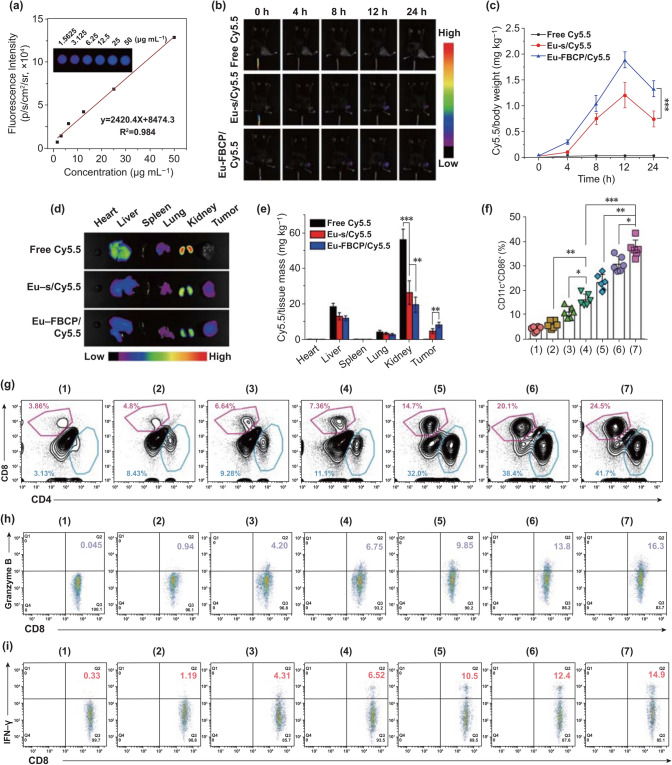
Fig. 6.
In vivo biodistributions of Eu-FBCP/Cy5.5 (or Eu-s/Cy5.5) and antitumor immune responses from different treatments (1: PBS, 2: free PTX, 3: Eu-s/PTX, 4: Eu-FBCP/PTX, 5: aPL, 6: Eu-s/PTX + aPL, and 7: Eu-FBCP/PTX + aPL). a Calibration curves of fluorescent Cy5.5 in the concentration range of 1.5625 to 50.0000 µg/mL obtained using an animal imaging system after in vivo exposure. b Time profiles (0, 4, 8, 12, and 24 h) of the fluorescence to examine the tumor accumulation of Eu-FBCP/Cy5.5 and Eu-s/Cy5.5, as well as free Cy5.5 for comparison after intravenous injection. c Cy5.5 distributions in tumors for the time points. d, e Representative fluorescence images and the quantified data for major organs and tumors collected from the 24 h-treated mice. f Intratumoral maturation of the DCs from intravenous injections with different treatments (1–7) (n = 6; *p < 0.05, **p < 0.01, and ***p < 0.001). g Plots of CD4+–CD8+ T cells infiltrated into the tumor microenvironment after the treatments (1–7). h, i Plots of CD8+–granzyme B+ and CD8+–IFN-γ+ levels from intratumorally infiltrated CD8+ T cells after the treatments (1–7)

