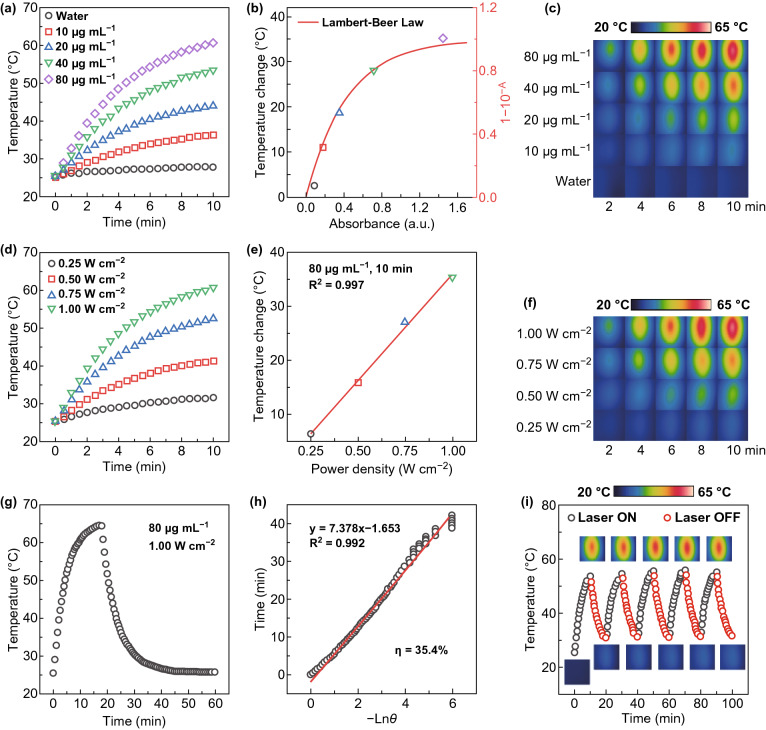
Fig. 2.
Photothermal effect of IID-ThTPA NPs. a Photothermal heating curves of IID-ThTPA NPs with different concentrations (671 nm, 1.00 W cm−2). b Plot of the temperature changes of IID-ThTPA NPs versus the absorbance at different concentrations with a fitted curve derived from Lambert–Beer law. c Infrared thermographs of IID-ThTPA NPs with different concentrations under laser irradiation at various time points (671 nm, 1.00 W cm−2). d Photothermal heating curves of IID-ThTPA NPs (80 μg mL−1) under 671-nm laser irradiation with different power densities. e Plot of the temperature changes of IID-ThTPA NPs versus the laser power densities with a linearly fitted line. f Infrared thermographs of IID-ThTPA NPs (80 μg mL−1) under 671-nm laser irradiation with different power densities at various time points. g Photothermal heating curve to calculate the photothermal conversion efficiency. IID-ThTPA NPs (80 μg mL−1) were irradiated by a 671-nm laser with a power density of 1.00 W cm−2 to reach a temperature plateau; then, the laser was shut off and the temperature was allowed to cool to room temperature naturally. h Plot of linear time data from the cooling period of IID-ThTPA NPs versus negative natural logarithm of the driving force temperature (θ). i Photothermal heating curve of IID-ThTPA NPs (40 μg mL−1) for five laser on/off cycles under irradiation (671 nm, 1.00 W cm−2) (insets are the infrared thermographs of IID-ThTPA NPs at different time points during the laser on/off cycles)

