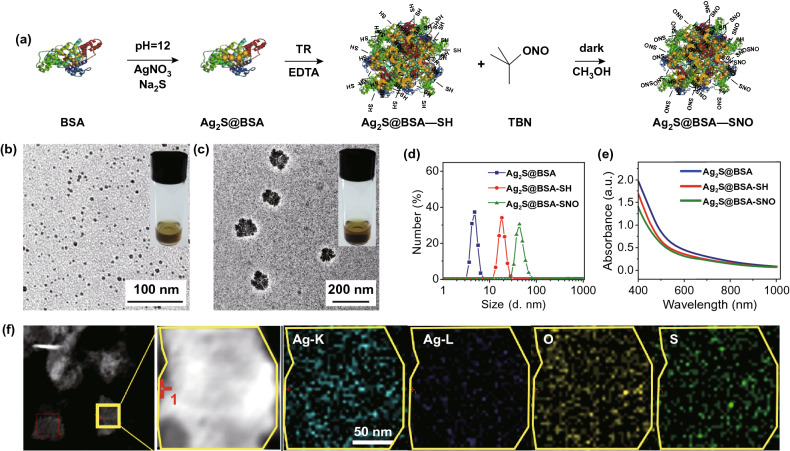
Fig. 1.
Schematic illustration and characterization of Ag2S@BSA-SNO nanoparticles. a A schematics illustration showing Ag2S growth in BSA nanocage and NO donor function group formation. b, c TEM images of Ag2S@BSA and Ag2S@BSA-SNO. Inset: picture of Ag2S@BSA and Ag2S@BSA-SNO solution (20 mg mL−1). d Dynamic light scattering (DLS) analysis of Ag2S@BSA, Ag2S@BSA-SH and Ag2S@BSA-SNO. e UV–Vis–NIR spectra of Ag2S@BSA, Ag2S@BSA-SH and Ag2S@BSA-SNO solution. f STEM image of Ag2S@BSA-SNO nanoparticles to show elements’ locations

