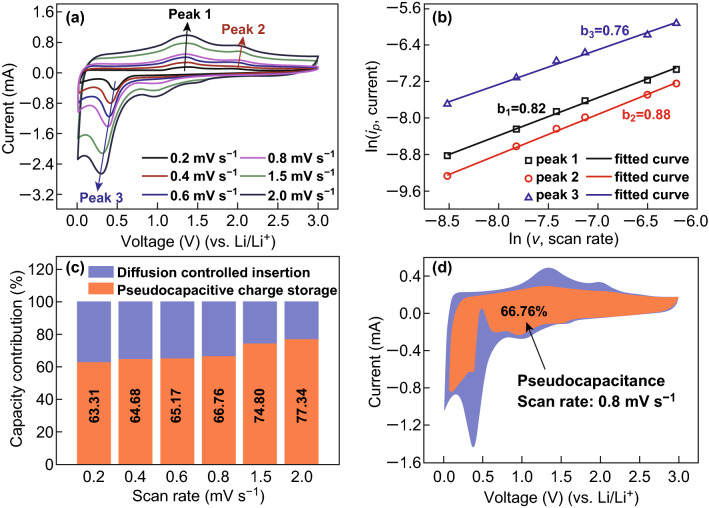
Fig. 7.
a CV profiles of the MnO/CoMn2O4 ⊂ GN electrodes at different scan rates with the potential range between 0.01 and 3.0 V. b The fitted lines and ln(ip) versus ln(v) plots at different oxidation and reduction states. c The percentages of pseudocapacitive contribution at different scan rates. d Pseudocapacitive (red) and diffusion-controlled (blue) contribution to the charge storage of MnO/CoMn2O4 ⊂ GN at 0.8 mV s−1. (Color figure online)

