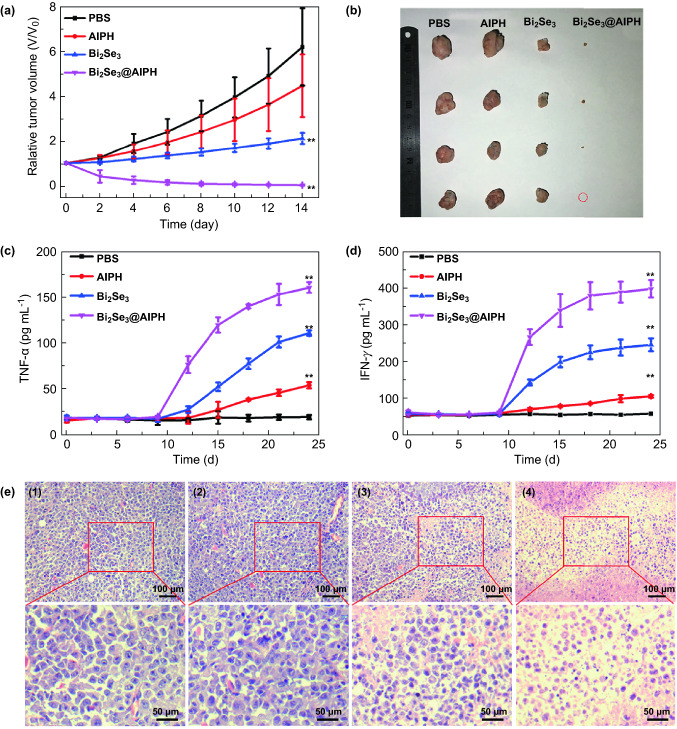
Fig. 7.
a Relative tumor volume changes in 14 days. b Photographs of the excised tumors after 14 days of treatment. c The TNF-α and d IFN-γ level during the treatment measured every 3 days. The vaccination of H22 tumor cells marked as 0 day, and the treatment starts at day 9. e Images of tumor sections by H&E staining. *p < 0.05, **p < 0.01

