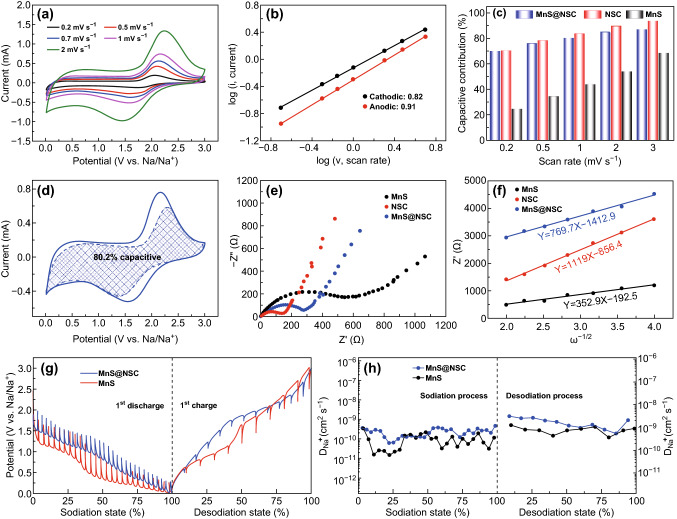
Fig. 4.
a CV curves of MnS@NSC electrode at different scan rates. b Analysis of b value for cathodic and anodic peaks of MnS@NSC. c Capacitive contribution of MnS@NSC, NSC, and MnS electrodes at different scan rates. d Capacitive contribution of MnS@NSC electrode at 1 mV s−1. e Nyquist plots of NSC, MnS, and MnS@NSC electrodes. f The relationship plots of Z′ versus ω−1/2 at low-frequency region for NSC, MnS, and MnS@NSC electrodes. g GITT curves (repeated discharging the cells for 1200 s at 0.1 A g−1 followed by 1800 s relaxation) and h corresponding Na+ diffusion coefficient at different discharge/charge states of MnS and MnS@NSC electrodes

