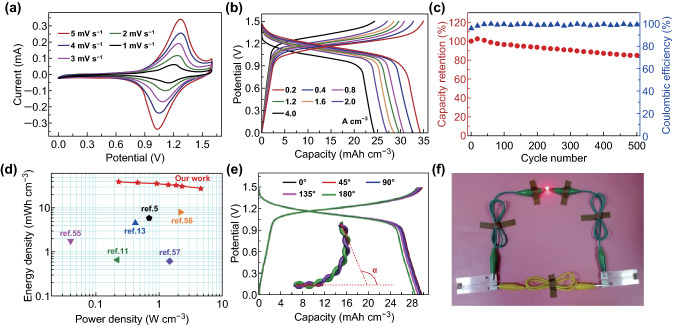
Fig. 6.
a CV curves at various scan rates from 1 to 5 mV s−1, b GCD curves at various current densities from 0.2 to 4.0 A cm−3, c cycle stability and corresponding coulombic efficiency at 2.0 A cm−3, and d Ragone plot of the quasi-solid-state FARSIB with a CMC-Na2SO4 polymer electrolyte. e GCD curves of the FARSIB at various bending angles. f LED powered by two FARSIBs in series

