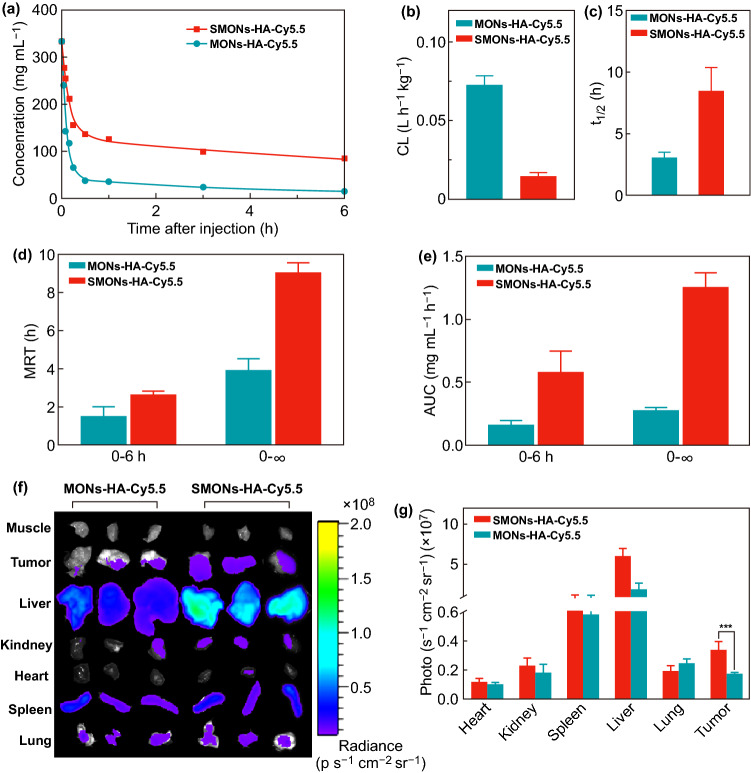
Fig. 4.
Blood circulation and tumor accumulation. a Concentrations of Si in the blood at different time intervals after injection of MONs-HA-Cy5.5 and SMONs-HA-Cy5.5. b The corresponding clearance (CL), c the terminal phase half-life(t1/2), d the mean residence time (MRT) and e blood concentration versus time curve (AUC) of MONs-HA-Cy5.5 and SMONs-HA-Cy5.5 by fitting the circulation profile. f Near-infrared fluorescence (NIFR) imaging and g quantification of the fluorescence intensity in the major organ and tumor from MCF-7 bearing mice (n = 3) at post-24 h after the administration of the SMONs-HA-Cy5.5 or MONs-HA-Cy5.5. ***P < 0.001

