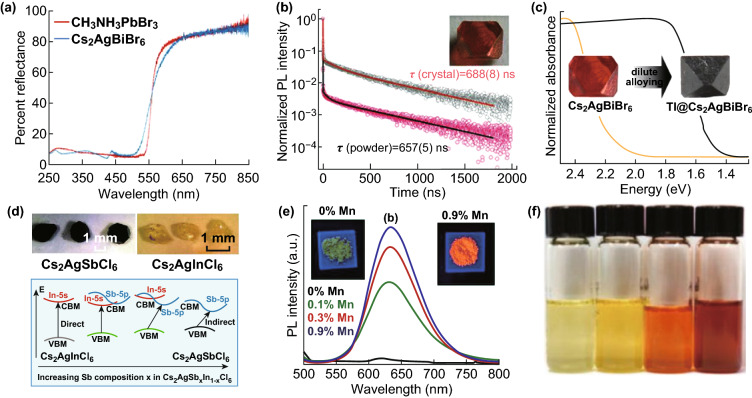
Fig. 2.
a Diffuse reflectance spectra of Cs2AgBiBr6 and CH3NH3PbBr3. Reproduced with permission from Ref. [48]. b Time-resolved room-temperature PL and fits for the PL decay time (τ) in powder and single-crystal samples. The inset is the photograph of a Cs2SgBiBr6 single crystal. Reproduced with permission from Ref. [52]. c Apparent bandgaps of Cs2AgBiBr6 and Cs2(Ag1−aBi1−b)TlxBr6 (x = a + b = 0.075) single crystals extracted by linear fits to α2 vs. E (direct gap) and α1/2 vs. E plots (indirect gap). Reproduced with permission from Ref. [57]. d Photographs of Cs2AgSbCl6 and Cs2AgInCl6 single crystals (top), and band diagram. A change in the character of the conduction band minimum (CBM) from s orbital derived to p orbital derived while having the valence band maximum (VBM) primarily Ag-d states results in a transition from direct to indirect bandgap. Reproduced with permission from Ref. [59]. e PL spectra of Mn-doped Cs2AgInCl6 with different Mn contents, after excitation with 340 nm light. Insets show photographs of luminescence from powder samples under UV light. Reproduced with permission from Ref. [62]. f Photograph of dilute toluene solutions of Cs2AgBiBr6, Cs2AgBiBr5.2I0.8, Cs2AgBiBr1.6I4.4 and Cs2AgBiI6 nanocrystals. Reproduced with permission from Ref. [51]

