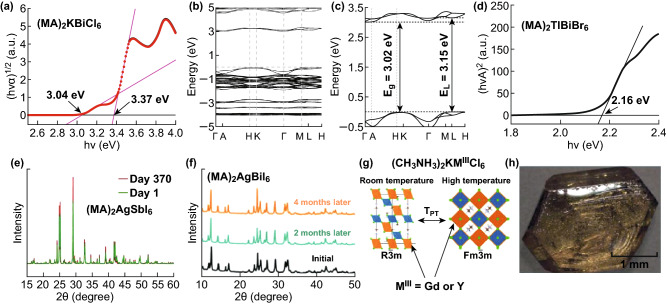
Fig. 3.
a Tauc plot (assumed indirect bandgap), b-c calculated band structure of (MA)2KBiCl6 and the enlarged view of the band structure near the bandgap. Reproduced with permission from Ref. [38]. d Tauc plot (assumed direct bandgap) of (MA)2TlBiBr6. Reproduced with permission from Ref. [82]. e XRD patterns of fresh (MA)2AgSbI6 compared to (MA)2AgSbI6 after 370 days of exposure to air. Reproduced with permission from Ref. [84]. f Air stability of (MA)2AgBiI6. Reproduced with permission from Ref. [85]. g Schematic illustration of rhombohedral-to-cubic phase transition on high-temperature heating for (MA)2KGdCl6 and (MA)2KYCl6. Reproduced with permission from Ref [86]. h Photograph of a (MA)2AgBiBr6 single crystal. Reproduced with permission from Ref. [87]

