
Figure 2.
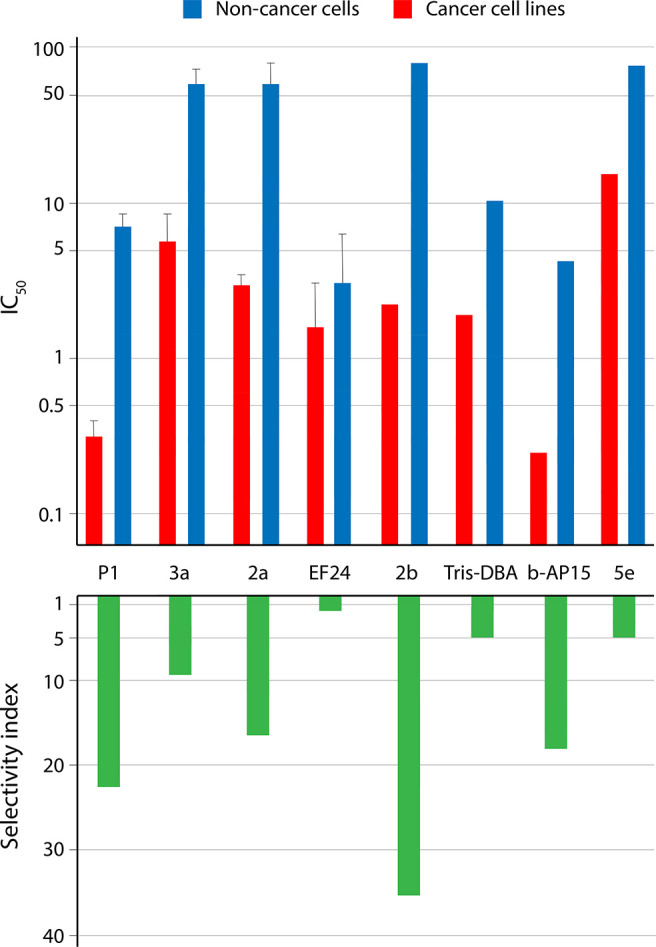
Tumor cell selectivity of dienone compounds. The log10 IC50 values are shown on the y-axis in the upper graph and selectivity indices on the y-axis in the lower graph. Shown are the mean ± SD values where possible to calculate (i.e., where data from three or more cell lines were reported). The figure is based on the data in presented Supplementary Table 1.