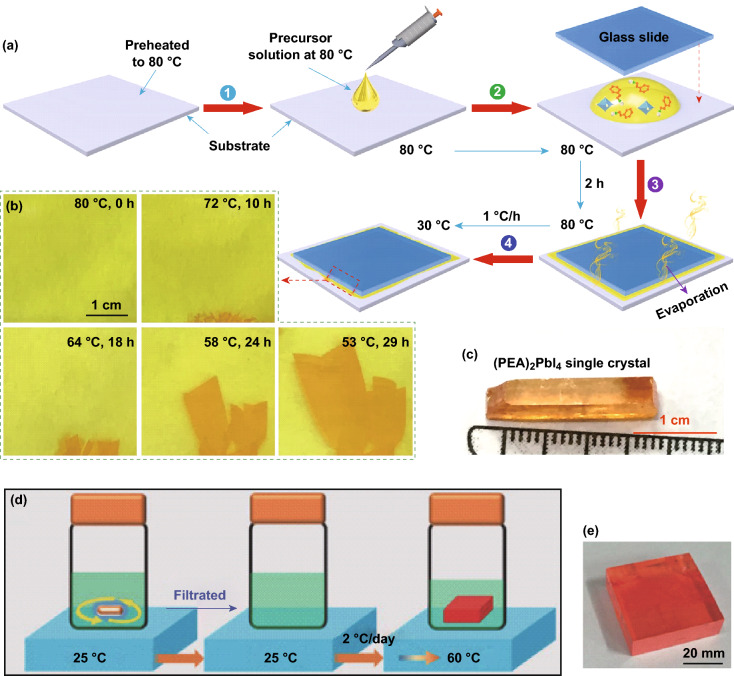
Fig. 4.
a Schematic illustration of the IPC procedure. b Photographs of PEA2PbI4 taken at different stages of the growth process. c Photograph of a typical PEA2PbI4 crystal [71]. Copyright © 2018 Elsevier, Ltd. d Schematic illustration of the low-temperature-gradient crystallization (LTGC) process for MAPbBr3 single crystals. e Photograph taken from a MAPbBr3 single crystal [72]. Copyright © 2018 WILEY-VCH Verlag GmbH & Co. KGaA, Weinheim

