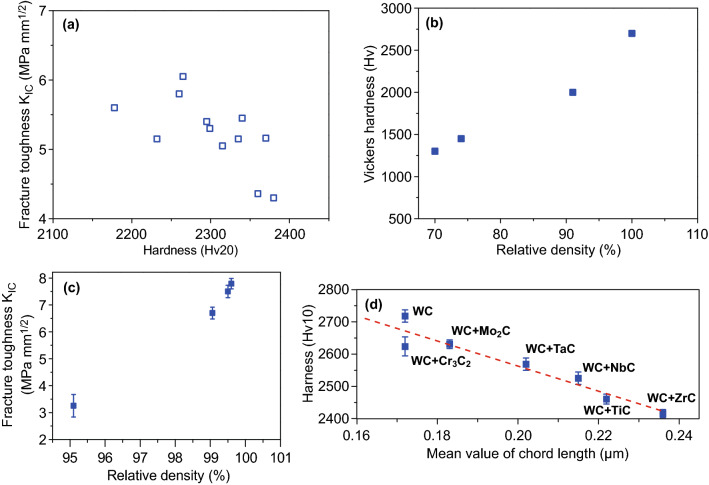
Fig. 17.
a Plot of fracture toughness versus hardness of BTC [126]. b Plot of hardness and c fracture toughness versus relative density [119, 179]. d Plot of hardness versus chord length of dense samples [180].
Figure panels reproduced from Ref. [126] with permission from IEEE copyright 2005, Ref. [119] with permission from Elsevier copyright 2006, Ref. [179] with permission from Elsevier copyright 2017, Ref. [180] with permission from EPMA copyright 2014

