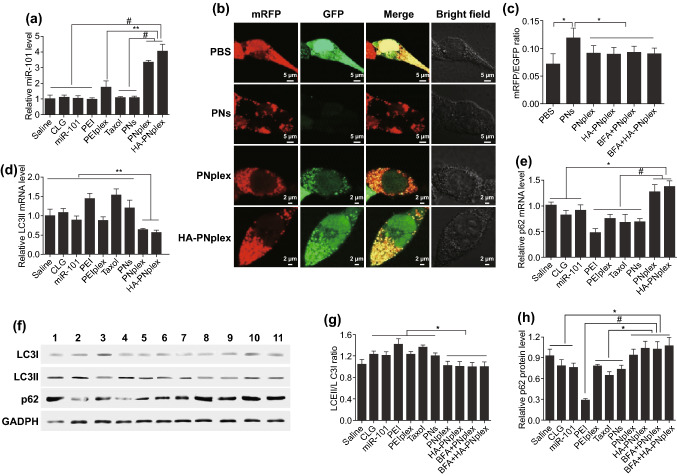
Fig. 2.
Intracellular delivery of miR-101 and in vitro inhibition of autophagic flux. a miR-101 expression in MCF-7 cells with PTX concentration of 10 μg mL−1 or a miR-101 at concentration of 100 nM after 24 h incubation at 37 °C as determined using PCR assay (n = 3, #P < 0.001 and **P < 0.01). b–h In vitro inhibition of autophagic flux. b CLSM images showing the autophagy flux in mRFP/EGFP-MCF-7 cells with PTX concentration of 10 μg mL−1 or a miR-101 at concentration of 100 nM after 24 h incubation at 37 °C. The green fluorescence is negatively correlated with the fusion of autophagosomes and lysosomes. The yellow fluorescence indicates the absent fusion of autophagosomes and lysosomes. c Quantitative mRFP/EGFP ratio determined by flow cytometry (n = 3, *P < 0.05). d LC3II and e p62 mRNA expression level in MCF-7 cells assessed using PCR assay (n = 3, *P < 0.05, **P < 0.01 and #P < 0.001). f LC3I, LC3II and p62 expression level in MCF-7 cells determined using the WB assay. Quantitative analysis of g LC3II/LC3I ratio and h p62 based on WB assay (n = 3, #P < 0.001 and *P < 0.05). The internal control for normalizing protein expression was GADPH. Formulations: 1, saline; 2, CLG; 3, naked miR-101; 4, PEI; 5, PEI/miR-101 complexes (PEIplex); 6, Taxol; 7, PNs; 8, PNplex; 9, HA-PNplex; 10, BFA+PNplex; 11, BFA+ HA-PNplex

