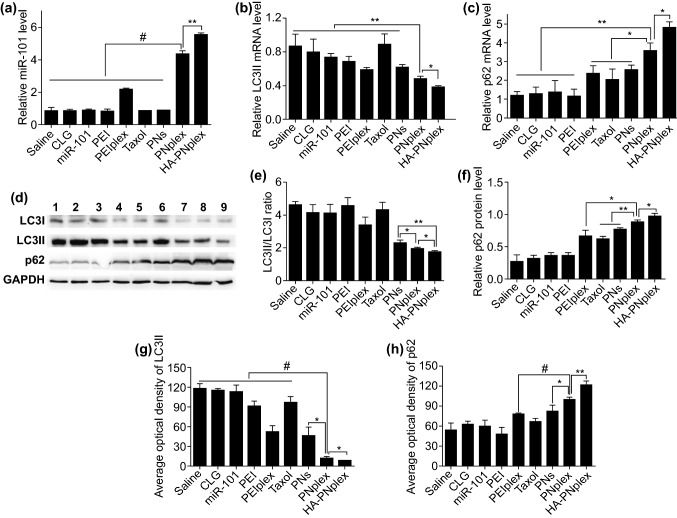
Fig. 5.
In vivo miR-101 expression and inhibition of autophagy flux. a miR-101 expression level in tumor was determined by PCR assay (n = 3, **P < 0.01 and #P < 0.001). The tumors were collected from mice on day 16 at the end of the experiment. b–h In vivo inhibition of autophagy flux. At the end of the experiment for antitumor efficiency, the tumor tissues were isolated. b LC3II and c p62 mRNA expression level in tumor determined by PCR assay (n = 3, *P < 0.05 and **P < 0.01). d LC3I, LC3II and p62 expression level in tumor determined using the WB assay. Formulations: 1, saline; 2, CLG; 3, naked miR-101; 4, PEI; 5, PEI/plex; 6, Taxol; 7, PNs; 8, PNplex; 9, HA-PNplex. The internal control for normalizing protein expression was GADPH. Quantitative analysis of e LC3II/I ratio and f p62 in tumor (n = 3, **P < 0.01 and *P < 0.05). The immunohistochemistry quantification of g LC3II and h p62 in the tumors (n = 3, *P < 0.05, **P < 0.01 and #P < 0.001)

