Fig. 1.
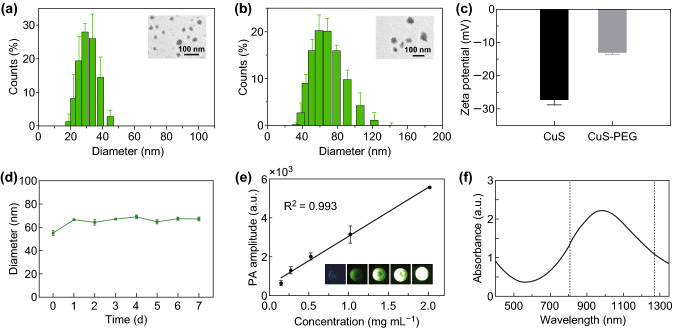
Characterization of CuS NPs and CuS-PEG NPs. a Morphology and size of CuS NPs. b Morphology and size of CuS-PEG NPs. c Apparent zeta potential of CuS NPs and CuS-PEG NPs. d Diameters of CuS-PEG NPs stored in FBS. e Linear fitting plots of PA amplitudes versus the concentration of CuS-PEG NPs under NIR laser irradiation. The inset is the PA image of CuS-PEG solution with different concentrations. f Absorption spectrum of CuS-PEG NPs. The error bars represent standard deviations (n = 3 per group)

