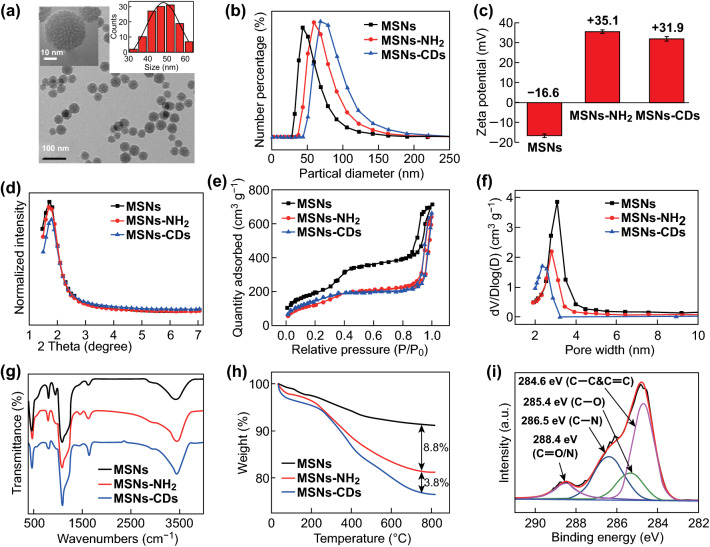
Fig. 1.
a TEM image of the MSNs–CDs nanohybrid (inset: high-resolution image and size distribution of MSNs–CDs). b Hydrodynamic diameter distributions, c zeta potentials, d small-angle XRD patterns, e N2 adsorption–desorption isotherms, f pore size distribution curves, g FT-IR spectra, and h TGA curves of MSNs, MSNs–NH2, and MSNs–CDs. i High-resolution C 1s XPS spectrum of the MSNs–CDs nanohybrid and fittings

