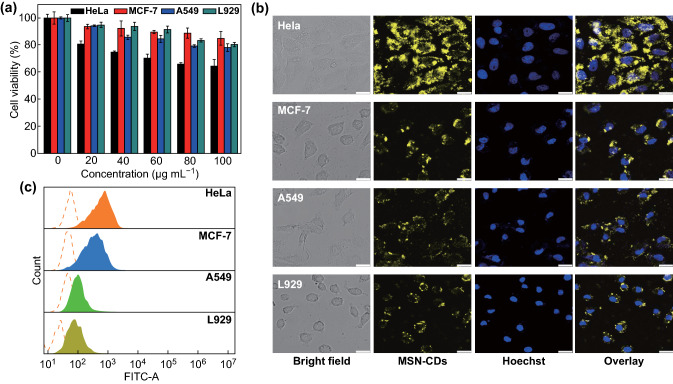
Fig. 4.
a Cytotoxicity of MSNs–CDs at different concentrations (0, 20, 40, 60, 80, and 100 µg mL−1) toward four types of cells (HeLa, MCF-7, A549, and L929). b CLSM images and c flow cytometric analysis results of different cells incubated with 200 μg mL−1 of MSNs–CDs for 4 h. Scale bar in b is 25 μm

