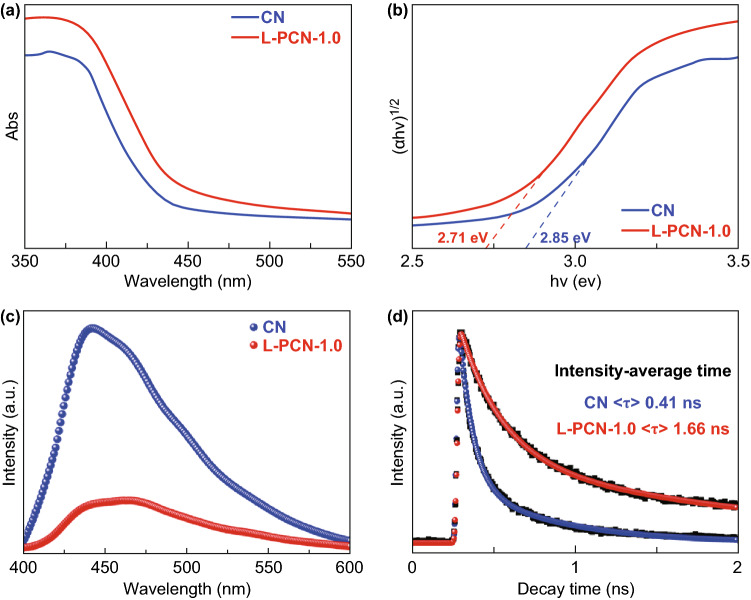
Fig. 5.
Optical properties characterization of CN and L-PCN. a UV–Vis DRS and b corresponding band gaps of CN and L-PCN-1.0 determined through the Tauc plots transformed from Kubelka–Munk function. c Photoluminescence emission spectra (with 350 nm excitation wavelength at room temperature) of CN and L-PCN-1.0. d Time-resolved photoluminescence decay spectra of CN and L-PCN-1.0. These spectra were recorded with the excitation of 400 nm from a picosecond pulsed light-emitting diode at room temperature

