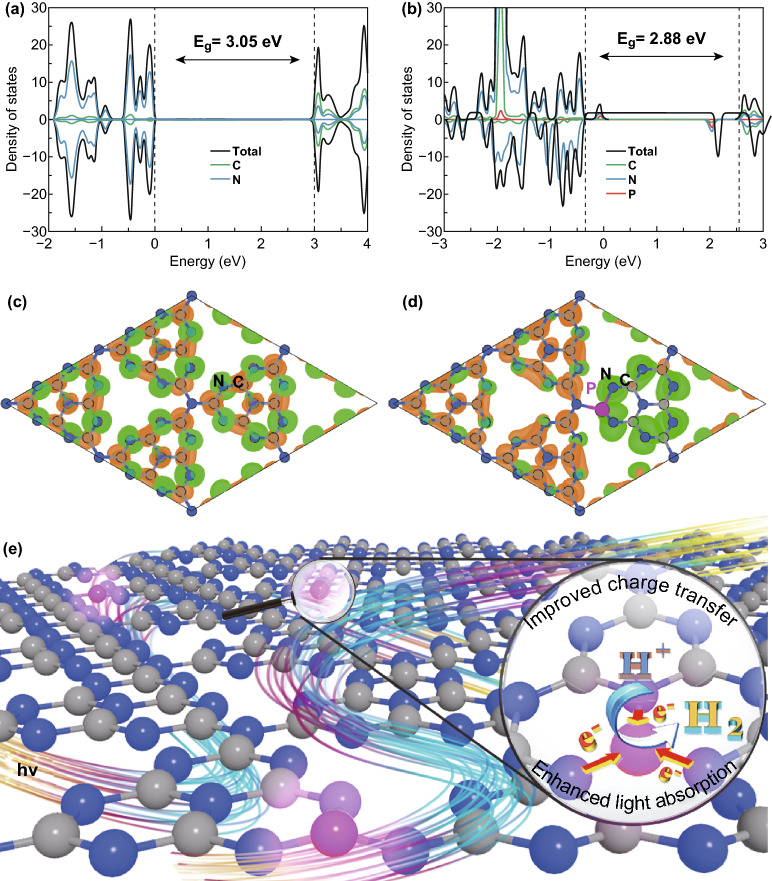
Fig. 8.
DFT calculations and photocatalytic mechanism of L-PCN. Total density of states and partial density of states for a CN and b P-doped CN. The electron density distributions of the highest occupied (green) and lowest unoccupied orbit (orange) of c CN and d P-doped CN with an isovalue of 0.02e Å−3. e Illustration of the photocatalytic process over L-PCN photocatalyst for hydrogen evolution. Gray, blue, and pink spheres represent the C, N, and P atoms. (Color figure online)

