Fig. 4.
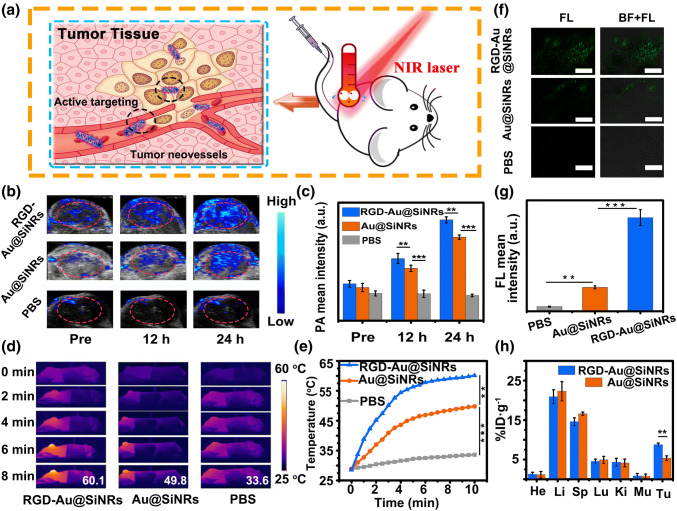
Tumor-targeted multimodal imaging in vivo. a Schematic illustration of the active targeting of RGD-Au@SiNRs. b PA imaging and c the corresponding PA signal intensity of tumor regions of CT-26 tumor-bearing mice untreated and treated with RGD-Au@SiNRs, Au@SiNRs, or PBS for 12 and 24 h. d Infrared thermal mapping images, and e corresponding temperature change of tumor regions of CT-26 tumor-bearing mice irradiated with an 808-nm laser (0.8 W cm−2) for different times (0 ~ 8 min, time interval: 30 s) at 24-h post-administration with RGD-Au@SiNRs, Au@SiNRs, or PBS. f LSCM images of tumor sections at 24-h post-injection of PBS, Au@SiNRs, or RGD-Au@SiNRs. Scale bars, 100 μm, and g corresponding quantitative analysis of the fluorescence intensity. h The bio-distribution of RGD-Au@SiNRs and Au@SiNRs measured by ICP-OES at 24-h post-administration. Asterisk (**) indicates p < 0.01; (***) means p < 0.001

