Fig. 5.
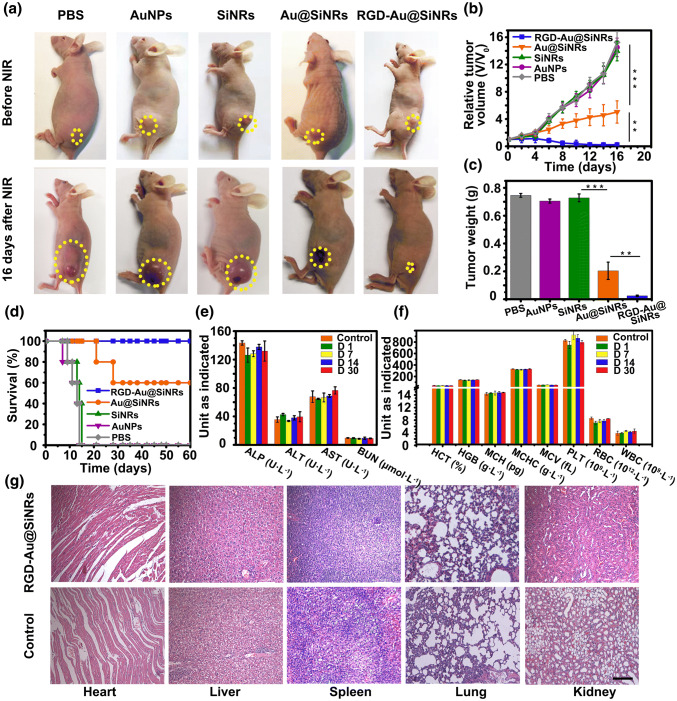
Photothermal therapy and safety assessment. a Photos of representative mice before and after the treatment with different agents and NIR irradiation. b Growth curves of tumor volumes of mice groups with NIR irradiation. c Weight of the excised tumors from the PTT-treated mice. d Survival curves of PTT-treated mice. e Serum biochemistry data including alkaline phosphatase, alanine aminotransferase, and aspartate aminotransferase, and blood urea nitrogen levels of control and RGD-Au@SiNRs-treated healthy mice. f Complete blood counts: hematocrit, hemoglobin, mean corpuscular hemoglobin, mean corpuscular hemoglobin concentration, mean corpuscular volume, blood platelets, red blood cells, blood levels of white blood cells, and platelets of control and RGD-Au@SiNRs-treated healthy mice. g H&E staining of various organ tissues harvested from tumor-bearing mice at the end of treatment. Asterisk (**) indicates p < 0.01; (***) means p < 0.001

