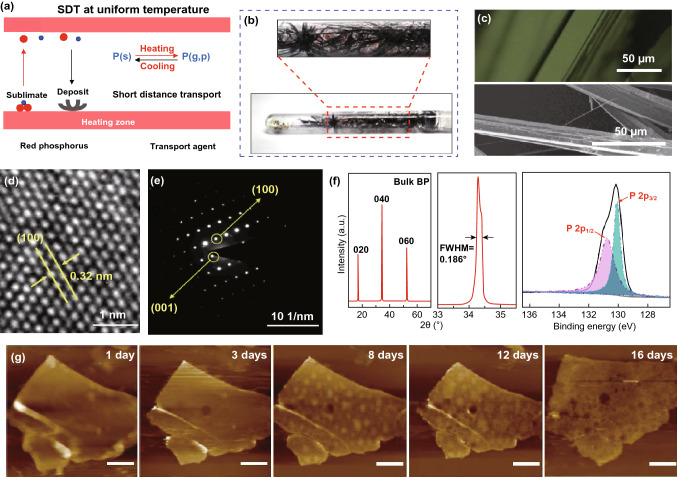
Fig. 4.
SDT growth of BP under a uniform temperature with the highest growth yield and purity. a Schematic mechanism of SDT technique. b Photographs of the products in a quartz ampoule after the reaction. c OM and SEM images of BP crystal laths; d, e HRTEM image and SAED pattern of a BP flake showing its high crystallinity; f XRD pattern of BP crystal. And magnified section of the (040) peak in the XRD pattern with a FWHM of 0.186o; i Raman spectrum of a BP crystal; g PL spectrum of monolayer BP under 77 K in vacuum with the sample was encapsulated by h-BN, showing a PL peak at 730.5 nm with a FWHM of 22.6 nm; h AFM images of a pristine BP flake with an as-exfoliated thickness of 25 nm, taken after ambient exposure for 1, 3, 8, 12, and 16 days. Reproduced with permission [142], Copyright 2020 Elsevier

