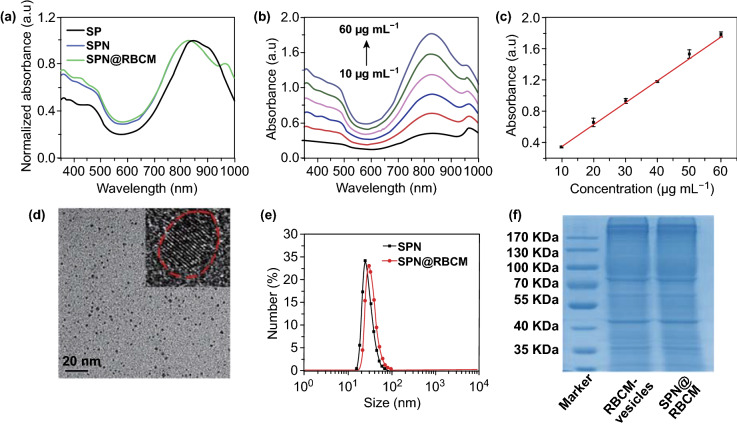
Fig. 1.
a Vis–NIR spectra of SP in THF, SPN and SPN@RBCM in PBS. b Vis–NIR spectra of SPN@RBCM in PBS at various concentrations ranged from 10 to 60 μg mL−1. c Corresponding absorbance of SPN@RBCM at 808 nm in b. d TEM image of SPN, the inset picture is the enlarged image of a single nanoparticle, while the red dashed circle indicated its crystal structure. e DLS results of SPN and SPN@RBCM. f SDS-PAGE electrophoresis patterns of RBCM vesicles and SPN@RBCM

