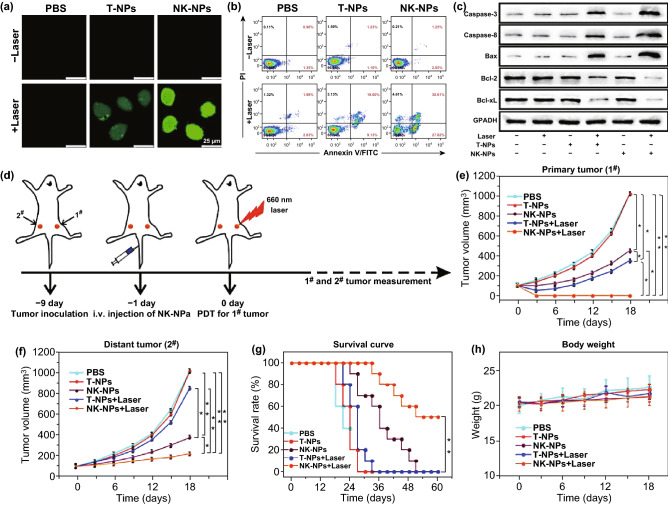
Fig. 10.
a ROS production in cells exposed to T- or NK-membrane NPs following 660 nm irradiation (100 mW cm−2) was assessed using the fluorescent DCFH-DA indicator. b Flow cytometric assessment of apoptotic induction in irradiated cells exposed to T- and NK-NPs. c Western blotting-mediated measurement of apoptosis-associated proteins in response to NK-NP + PDT treatment. d Overview of the study experimental design, with a dual 4T1 tumor implant model in which primary tumors on the right side received PDT, whereas distal tumors on the left side did not. e Primary tumor growth. f Distal tumor growth. g Morbidity-free survival of differently treated mice. h Changes in body weight of differently treated mice. (n = 10). (*p < 0.05, **p < 0.01).
Adapted from Ref. [128] with permission

