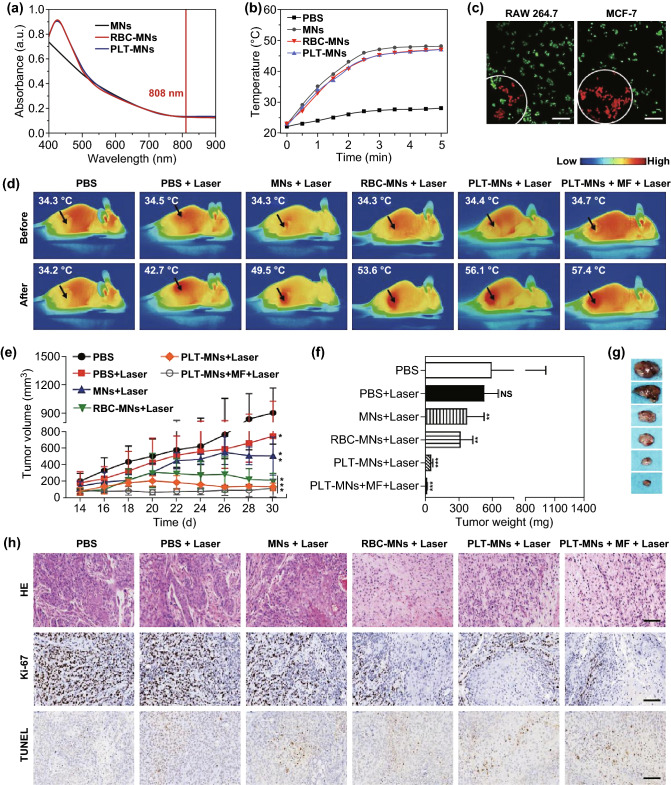
Fig. 8.
a NP UV–Vis absorption spectra. b Temperature change for control or NP preparations following 808 nm laser irradiation. c CLSM results from RAW 264.7 and MCF-7 cells following PLT-MN treatment and laser irradiation. FDA (green) and PI (red) were used to detect live and dead cells, respectively. Scale bar = 100 µm. d Representative in vivo IR thermal images from mice implanted using MCF-7 tumors following the indicated treatments. e Tumor volumes and f average weight following the indicated treatments. g Representative ex vivo tumor images and h HE-, Ki-67-, and TUNEL-staining of tumor tissue from differently treated animals. Scale bars = 200, 50, and 50 µm, respectively. Data are mean ± SEM (n = 6). NS: no statistical difference, *p < 0.05, **p < 0.01, ***p < 0.001, relative to PBS control. (Color figure online)
Adapted from Ref. [115] with permission

