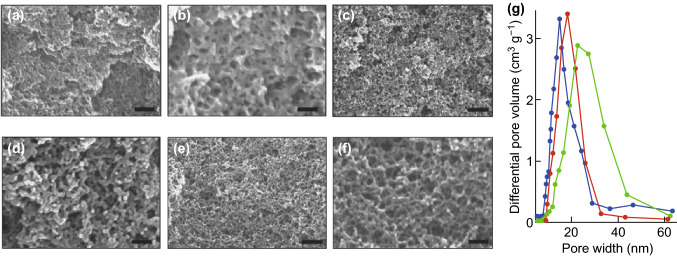
Fig. 16.
a–f SEM images of HKUST-1 synthesised in CO2-expanded DMF. a, b 2.0; c, d 4.5; e, f 6.6 MPa. Scale bars, 150, 50, 500, 150, 500, and 150 nm for a–f, respectively. g The mesopore size distribution curves for the Cu3(BTC)2 synthesised in CO2-expanded DMF at 2.0 MPa (blue curves), 4.5 MPa (red curves) and 6.6 MPa (green curves).
Reprinted with permission from Peng et al. [114]. Copyright CC BY-NC-SA 4.0. (Color figure online)

