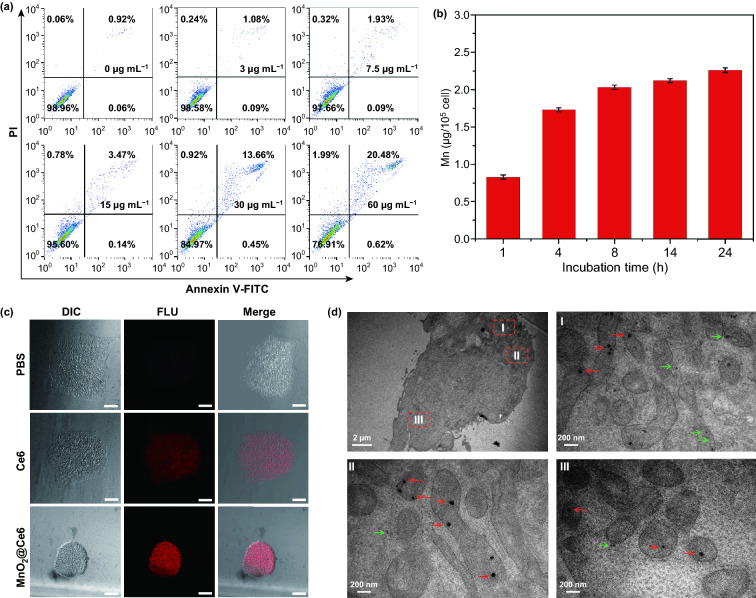
Fig. 2.
The loading of nanoprobes by iPS cells. a Flow cytometric analysis of iPS cells apoptosis induced by nanoprobes (Mn concentration: 0-60 μg mL−1). b Quantitative cellular uptake of MnO2@Ce6 by iPS cells measured by ICP-MS. c Confocal laser scanning microscopy images of iPS cells treated with Ce6 and MnO2@Ce6, all scale bars are 100 μm. d Representative TEM images of iPS cells incubated with nanoprobes. In the TEM images, the red arrows indicate the nanoprobe without degradation and the green indicate the nanoprobe with degradation

