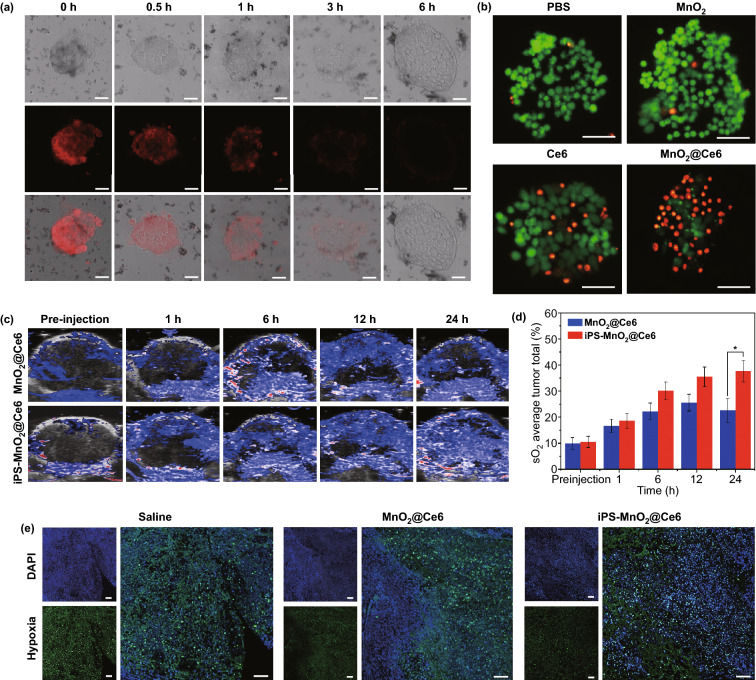
Fig. 3.
The excellent biological properties of iPS-MnO2@Ce6. a Confocal laser microscopy images of oxygen-sensing probe ([(Ru (dpp)3)]Cl2) in iPS cells showing the intracellular oxygen level incubated with nanoprobes for the indicated time. Scale bars are 50 μm. b Fluorescence images of Calcein AM (green)/PI(red) stained iPS cells incubated with free Ce6, MnO2, and nanoprobes. Scale bars are 50 μm. c Photoacoustic imaging showing saturated O2 (sO2) levels in tumors after injection of MnO2@Ce6 and iPS-MnO2@Ce6 at different time points. d The quantified tumor oxygen saturation levels calculated from c. Data were expressed as mean ± SD, (n = 3, *P < 0.05). e Representative immunofluorescence images of tumor sections after hypoxia staining. The nuclei and hypoxia regions were stained by DAPI (blue) and anti-pimonidazole antibody (green), respectively. Scale bars are 100 μm. (Color figure online)

