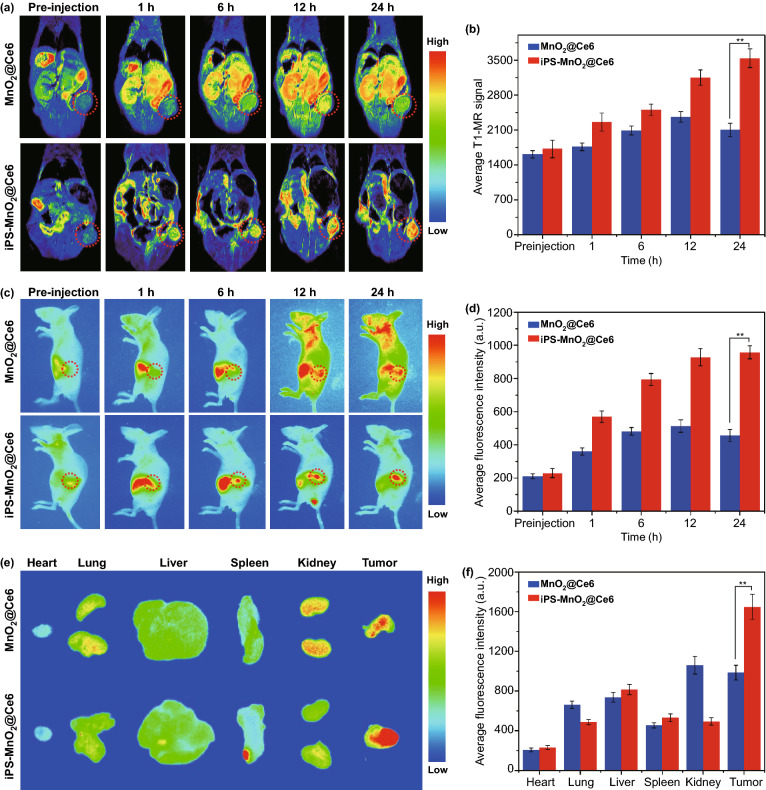
Fig. 4.
Distribution and metabolism of iPS-MnO2@Ce6 in tumor-bearing mice. a T1-MR images of tumor-bearing mice after the i.v. injection of MnO2@Ce6 and iPS-MnO2@Ce6 over a period of 24 h. b Quantitative analysis of T1-MR signal from tumor areas in (a). c Real-time fluorescence images of tumor-bearing mice after the i.v. injection of MnO2@Ce6 and iPS-MnO2@Ce6. d Quantitative analysis of fluorescence signal from tumor areas in c. e Ex vivo fluorescence images of major organs and tumor tissues. f Quantification of fluorescence signals from images shown in (e). Data were expressed as mean ± SD, (n = 3, **P < 0.001)

