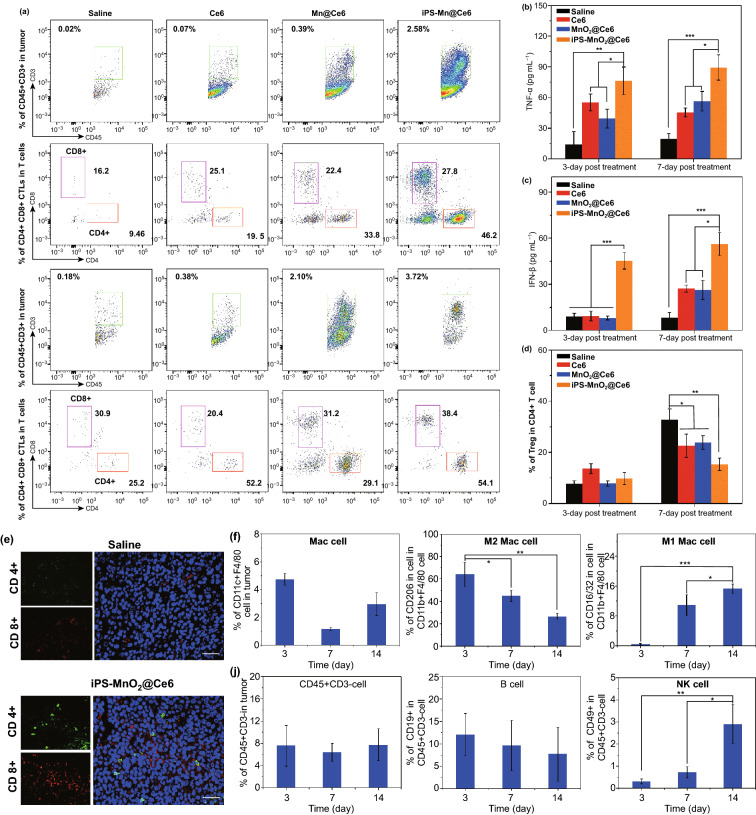
Fig. 6.
T cell response-based immunotherapeutic effect of iPS-MnO2@Ce6 in tumors. a Representative flow cytometric plots of CD4+ and CD8+ CTL in CD45+ CD3+ T cells for tumors from various groups at different time points post-laser-mediated treatments. The contents of b TNF-α and c IFN-β in tumor tissues from each groups at different time points after treatments. d The proportions of CD4+ Foxp3+ regulatory T cell (Treg) in CD4+ T cells. e Representative immunofluorescence images of tumor slides showing CD4+ and CD8+ T cells infiltrating into the tumor tissues. Green from CD4 antibody, red from CD8 antibody, and blue from DAPI. Scale bars are 50 μm. f The infiltrations of CD11c+ F4/80 cells (Mac cells), M2 Mac cell, and M1 Mac cell in tumors, j B cells and NK cells in tumors at different time points post treatments of iPS-MnO2@Ce6. Data were expressed as mean ± SD, (n = 5, *P < 0.05, ** P < 0.001, *** P < 0.001

