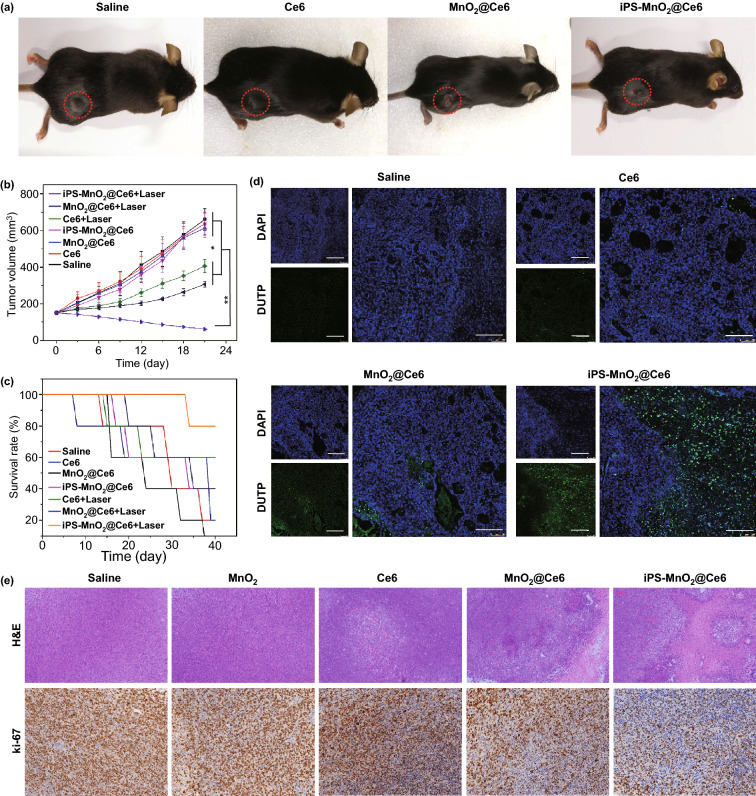
Fig. 7.
Anti-tumor activity of iPS-MnO2@Ce6 in vivo. a Representative photographs of the mice on 14th day post-combination therapy. b Changes of tumor volume with time increase in various groups after laser irradiation (n = 5 in per group). Statistical significance was calculated via two-tailed student’s t test. P value: *P < 0.01, **P < 0.001. c Survival curves of the mice in each group after different treatments (n = 5 in per group). d Representative TUNEL analysis of apoptosis in the tumor sections after different treatments. Scale bars are 100 μm. e Representative images of H&E and Ki67 stained tumor slides from the mice after different treatments. Magnification, 100 × and 200 × respectively

