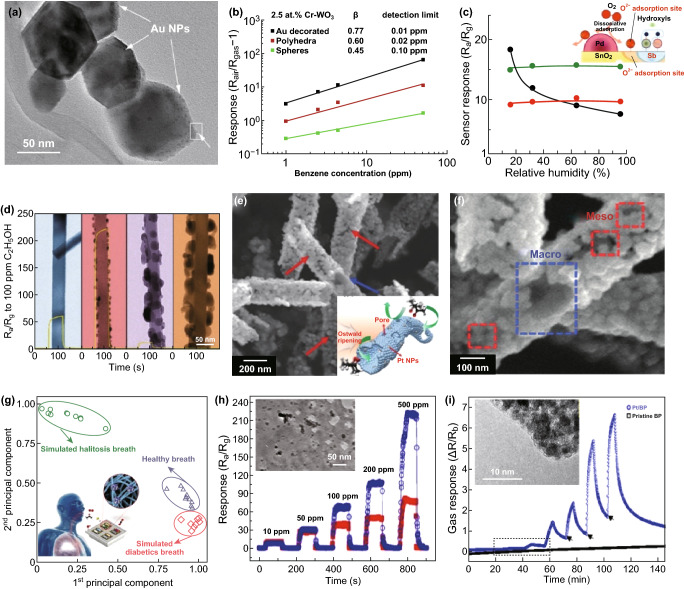
Fig. 3.
a SEM images of WO3 octahedron, b 2.5 at.% Cr–WO3 truncated octahedron and 10.0 at.% Cr–WO3 cuboid. Reproduced with permission [50]. Copyright 2015, American Chemical Society. c Humidity dependence of sensor response to 200 ppm hydrogen at 350 °C, using (black) undoped SnO2, (red) 0.1 mol % Sb-doped SnO2, and (green) 0.1 mol.% Pd-loaded and Sb-doped SnO2 nanoparticles. Reproduced with permission [89]. Copyright 2016, American Chemical Society. d TEM images of pure SnO2, 5Ag–SnO2, 10Ag–SnO2, and 50Ag–SnO2 NW after heating at 450 °C for 2 h and the corresponding response-recovery curves to ethanol gas. Reproduced with permission [51]. Copyright 2011, American Chemical Society. e, f SEM images of Pt–PS–SnO2 NTs (the inset is a schematic illustration). Reproduced with permission [52]. Copyright 2016, Wiley–VCH. g Pattern recognition by PCA using dataset from sensor arrays of PtM-decorated meso-WO3 NFs evaluating real and simulated (diabetes and halitosis) breath. Reproduced with permission [53]. Copyright 2017, Wiley–VCH. h TEM image of Pd nanoparticles@ZnO NSs and the corresponding response-recovery curves to acetone gas (red ZnO NSs). Reproduced with permission [54]. Copyright 2012, American Chemical Society. i Gas response of Pt/BP and pristine BP to various H2 concentrations (the inset shows the TEM images of Pt/BP). Reproduced with permission [55]. Copyright 2017, American Chemical Society. (Color figure online)

