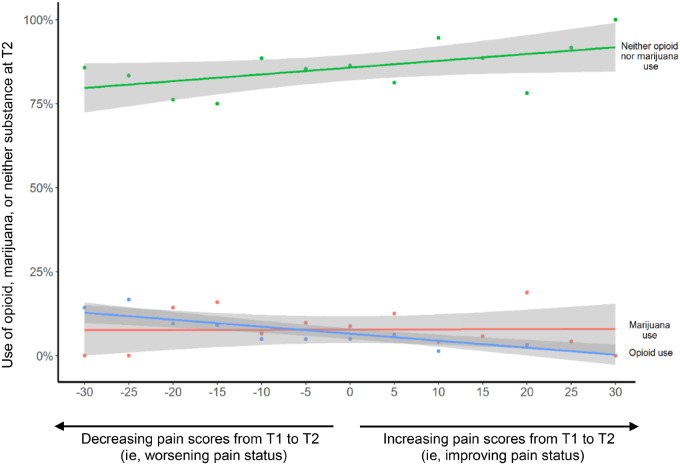
Figure 1.
The overall trend of using opioid, marijuana, or neither in associations with the change of pain scores over time. Change of pain scores over time in associations with the use of opioid or marijuana at a follow-up time point. This figure was created based on linear regression model, where the independent variables are the change of pain scores (a continuous variable) from T1 (baseline) and T2 (follow-up), and the dependent variable is the substance status at T2. The shading in the figure represents the 95% confidence intervals for the estimated association of the pain score change from T1 and T2 with the substance use at T2. Pain status was measured by the SF-36 Bodily Pain Scale as continuous scores with lower values indicating more pain; therefore, more positive values in this figure indicate improving pain status and more negative values indicate worsening pain status from T1 and T2. T1 was defined as the time point when survivors completed baseline medical evaluation and self-reported health survey, and T2 as the time point when St. Jude Lifetime Cohort Study (SJLIFE) survivors completed a follow-up evaluation and self-reported health survey.

