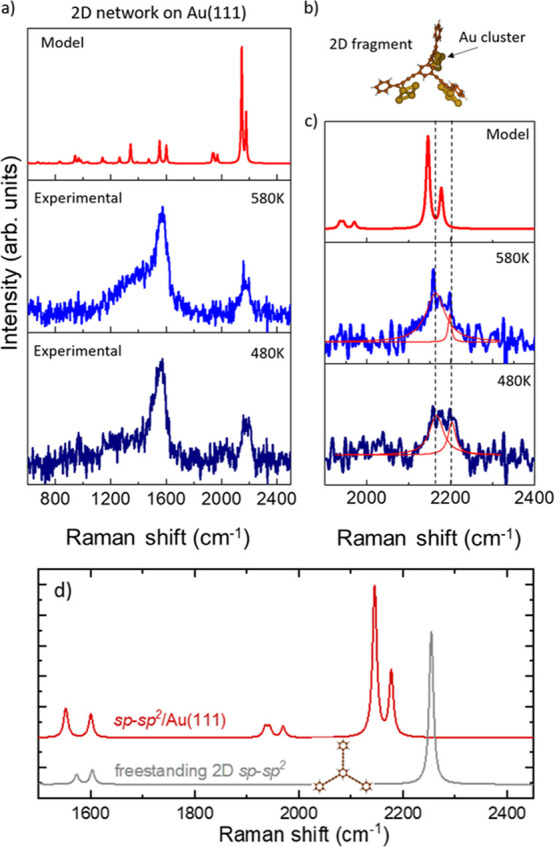
Figure 7.

(a) Ex situ Raman spectra of the 2D nanonetwork on Au(111) annealed at different temperatures and DFT calculations carried out on the molecular model shown in (b). (b) Complex composed of a fragment of the final 2D nanonetwork and Au cluster to mimic the interaction of the 2D nanonetwork with the substrate. (c) Magnification of the spectral range relevant to sp carbon (1900–2400 cm–1). (d) The calculated spectrum of the graphdiyne nanonetwork on Au(111) of panels (a) and (b) is compared with the freestanding case.
