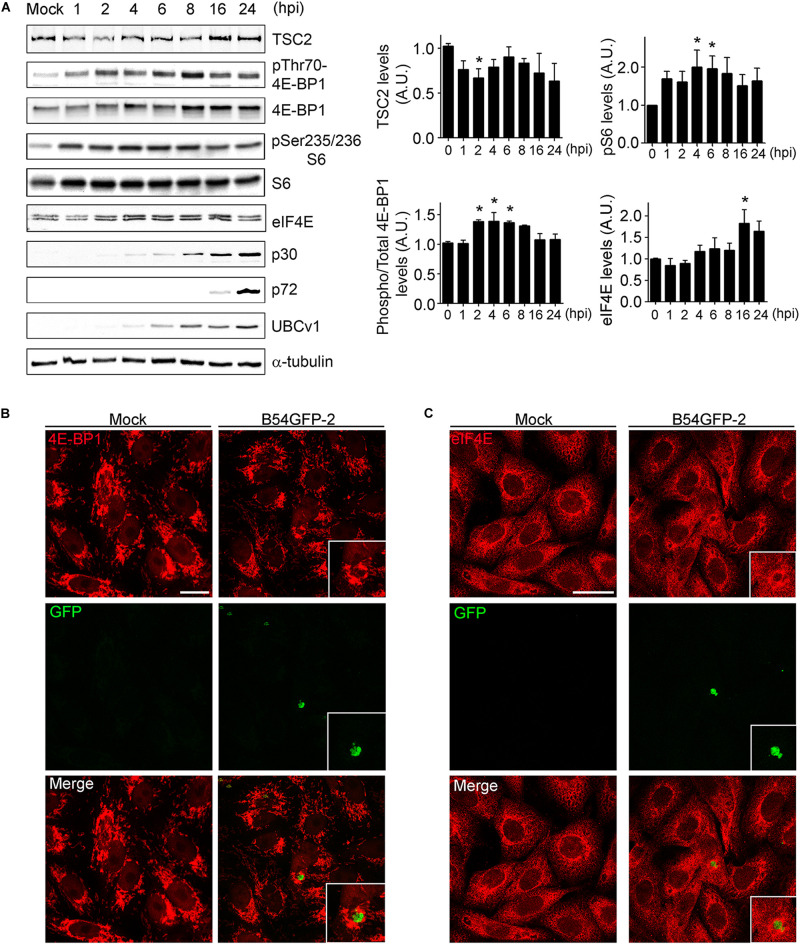
FIGURE 5.
ASFV infection regulates mTOR signaling. (A) TSC2, eIF4E, total and phosphorylated 4E-BP1 and S6 expression were analyzed at several times postinfection by WB using specific antibodies. Early p30, late p72, and UBCv1 proteins were included to confirm infection and tubulin as load control. Quantification of the bands was corrected to tubulin data, normalized to control values, and compared to uninfected cells (Mock). Significant differences are marked with asterisks (*p < 0.05). (B) Immunofluorescence (IF) to analyze 4E-BP1 expression (red) in B54GFP-2 (green) infected cells at 16 hpi localized in VFs. Bar = 20μm. (C) Immunofluorescence to analyze eIF4E expression (red) in B54GFP-2 (green) infected cells at 16 hpi localized in VFs. Bar = 20μm.

