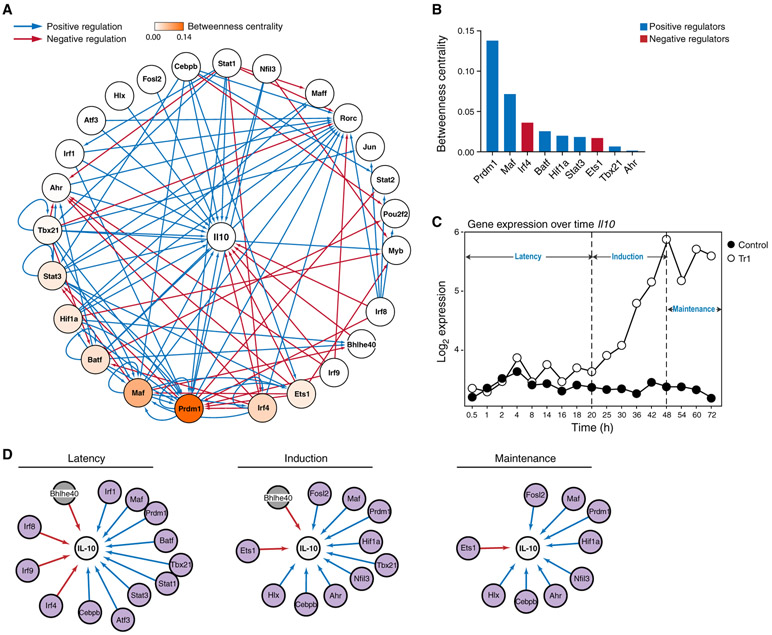
Figure 3. A Comprehensive Transcriptional Network Focused on Regulation of IL-10 by IL-27.
(A) General network of Il10 regulation by TFs in Tr1 cells, visualized using Cytoscape. Edges indicate causal regulatory targets identified using genetic perturbation by RNA-seq or qPCR. Blue and red edges indicate positive and negative regulations, respectively. Nodes are colored by betweenness centrality score.
(B) Betweenness centrality scores of the regulators in (A). Blue, positive regulator; red, negative regulator.
(C) Temporal expression of Il10 in Tr1 versus Th0 cells measured by microarray.
(D) Temporal regulation of Il10 in Tr1 cells, divided into 3 main phases: latency (0–20 h), induction (25–48 h), and maintenance (54–72 h). Purple nodes, increased by IL-27; gray nodes, decreased by IL-27.

