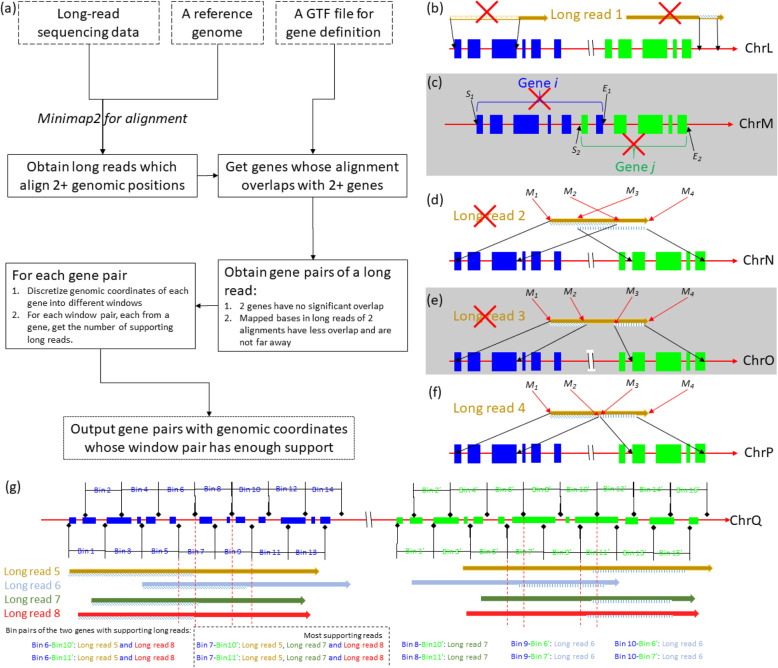
Fig. 1.
Illustration of the computational procedure used by LongGF. a A flowchart on LongGF, where the dashed boxes represent inputs. In panel (b) to (f), filled rectangles denote exons of gene and different colors denote different genes. The size of exons and bins are not proportional for demonstration purpose only. Pattern filled regions in long reads represent mapped bases in long reads. Information with red cross is not used for further analysis. b alignment against no gene; c two genes with significant overlap; d two alignments of a long read overlap significantly; e two alignments of a long read are far away; f two alignments of a long read are used for further analysis; g bin(window) pairs for two genes (in blue and in green) with the same aligned long reads. Dotted vertical lines help determine how alignment ends fall into bins

