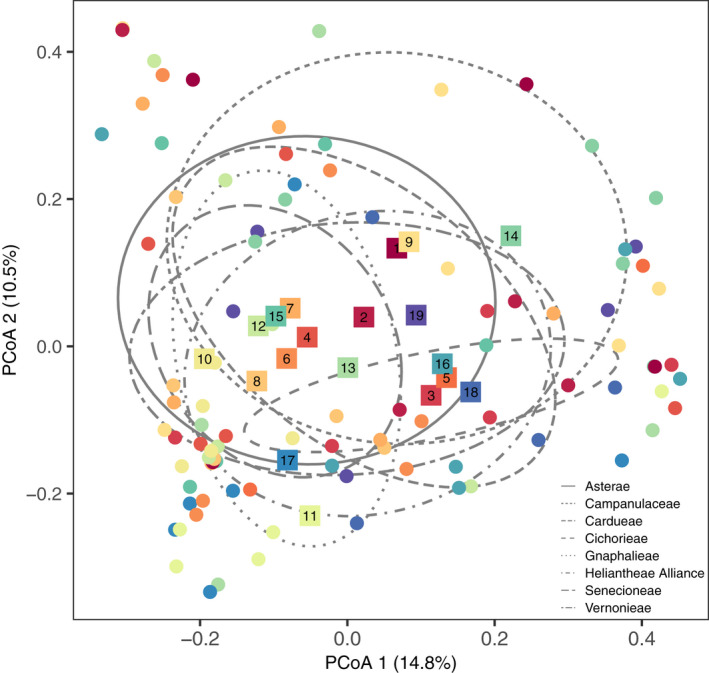
FIGURE 2.

FFE community structure varied by host species and tribe. The location of each host individual in ordination space is denoted by a filled circle, while the centroid, or average PCoA coordinates, of all 19 host species are shown as filled, numbered squares. Host species are color coded according to their phylogenetic relationship, where cooler colors represent more derived lineages and warmer colors represent more basal lineages—as shown in Figure 1a . The ellipses represent the centroid and standard deviation for each of the seven host tribes and the Campanulaceae family (i.e., Lobelia cardinalis) outgroup
