
FIGURE 3.
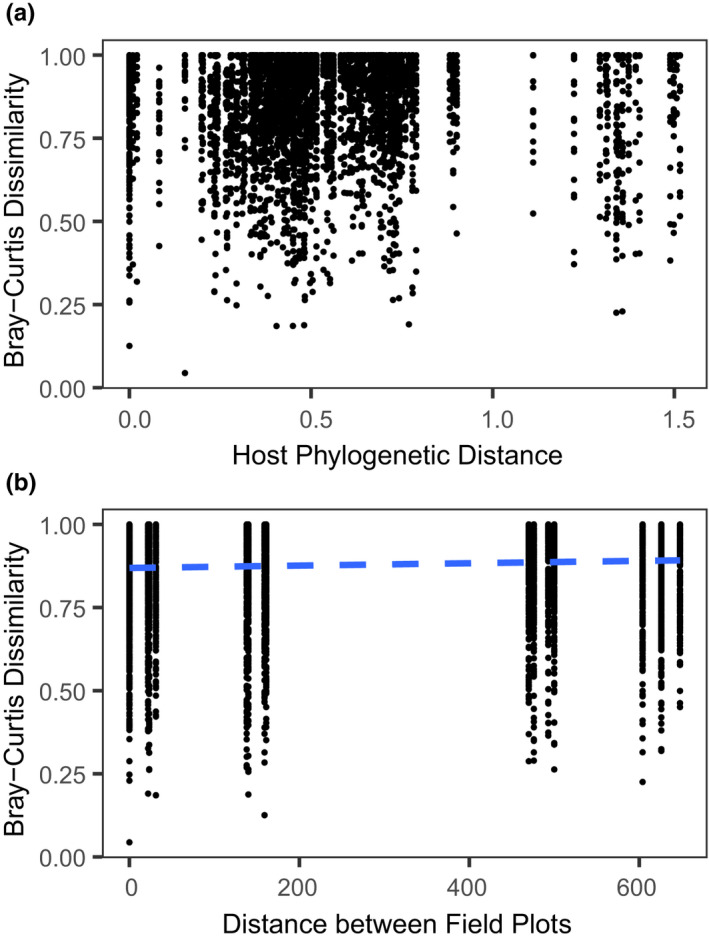
FFE community dissimilarity A) did not significantly correlate with host phylogenetic distance but B) did significantly correlate with spatial distance between common garden field plots. The regression line (blue‐dashed lines) characterizes the relationship between pairwise FFE community distance with pairwise distance between plots in the common garden. Each point represents a single pairwise comparison