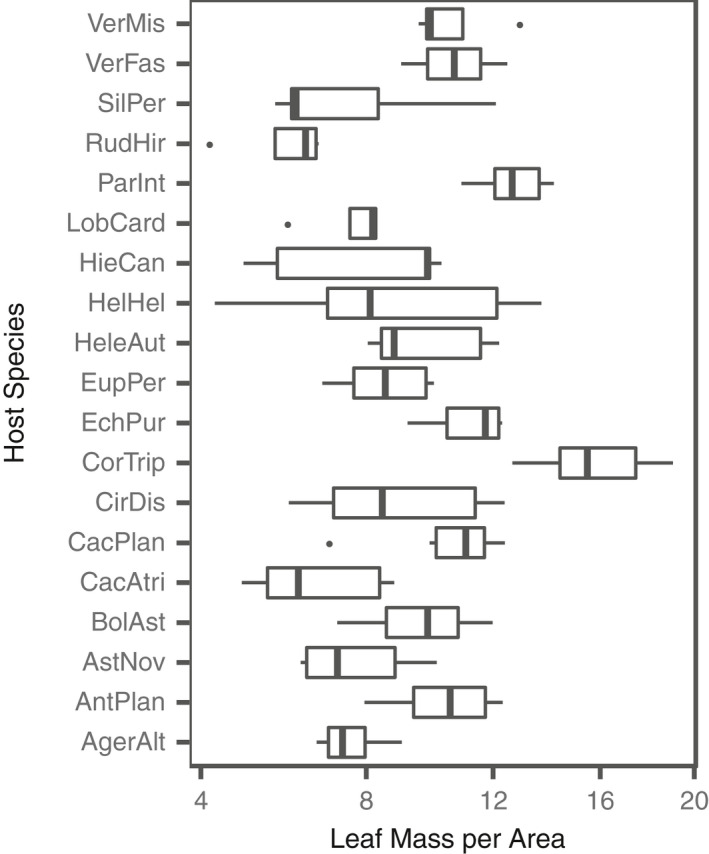
FIGURE A3.

Average Leaf Mass per Area (LMA) varied among host species. Boxplots are displayed for each species. The x‐axis is shown on a square‐root scale. Species are sorted alphabetically from bottom to top. The host species codes appear as in Table 1
