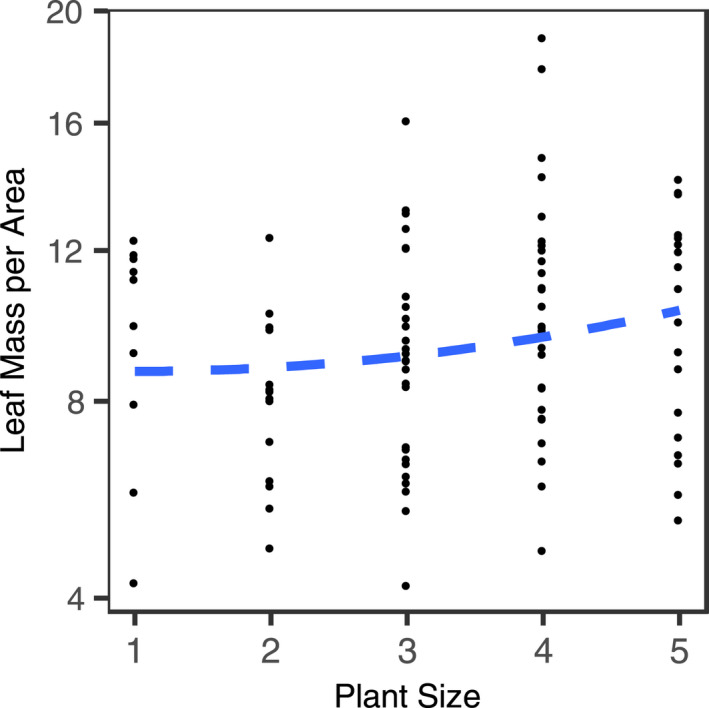
FIGURE A4.

Quadratic regression (blue dashed line) of Leaf‐Mass Area (LMA) against individual host size. Each point represents a single host individual. Individual plant size was qualitatively assigned to one of five size classes at the time of leaf collection. The y‐axis is shown on a square‐root scale. (Quadratic Term p = 0.0211; Linear Term p = 0.0033)
