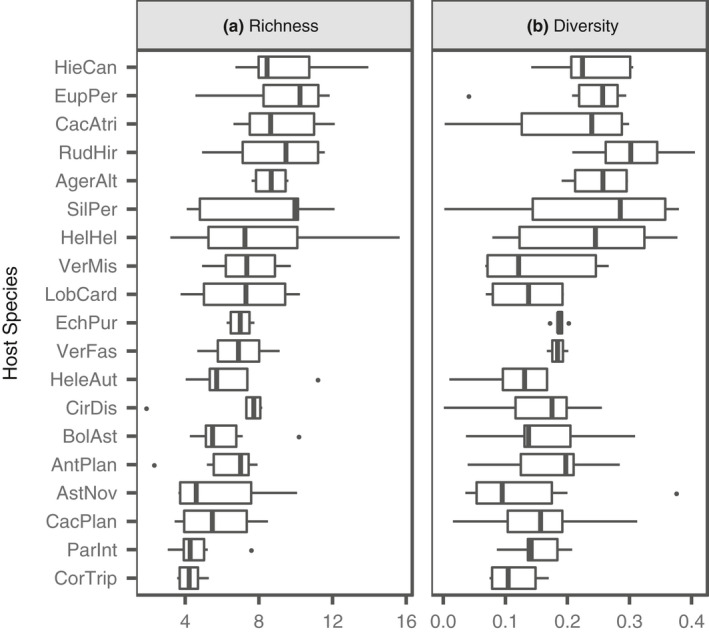
FIGURE A7.

FFE community (a) richness and (b) diversity did not vary significantly by host species. Boxplots are displayed for each species. For both panels, species have been sorted from least to highest FFE diversity. The host species codes appear as in Table 1. Richness and diversity have both been standardized by Leaf Mass per Area
