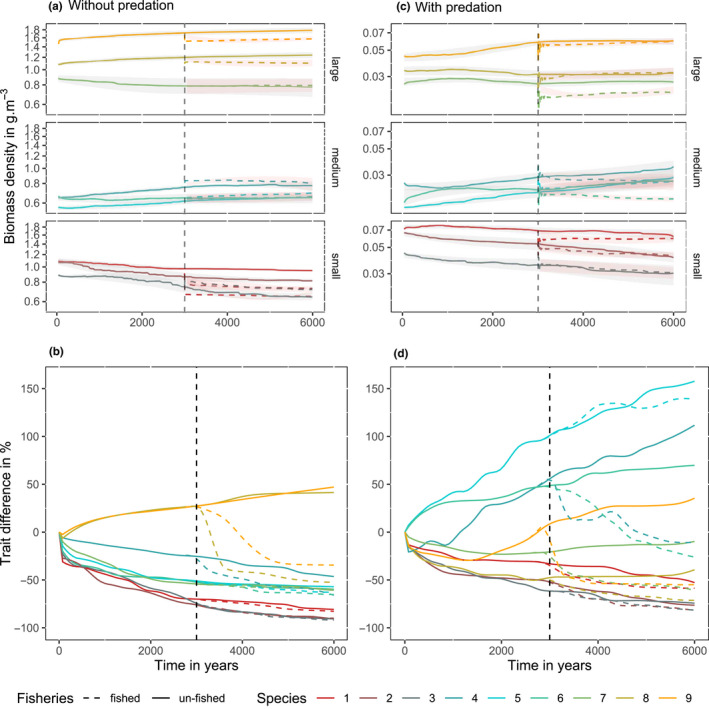
FIGURE 2.

Biomass and trait variation averaged and smoothed throughout all simulations in scenarios without predation (a, b) and with predation (c, d). (a, c) Is the change in species' biomass, the gray shading indicates the standard deviation across simulations. (a, c) Is divided in 3 panels (small, medium, large being the species asymptotic size) for more clarity. The vertical line shows the introduction of fishing and from this line, the dashed lines are the biomass when fished, with the red shading showing its standard deviation. (b, d) Is the proportional change in weighted mean maturation size for each species relative to its initial value averaged across all stochastic realizations. The vertical line shows the time where fishing is introduced, and the dashed line shows simulations with fisheries
