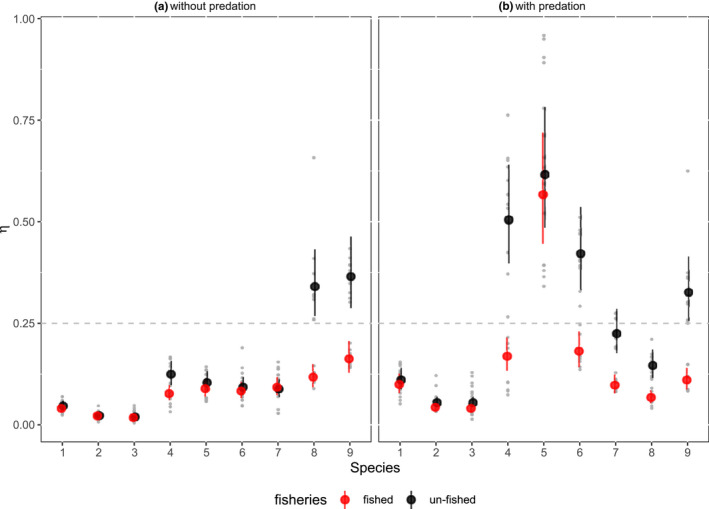
FIGURE 3.

Final maturation size (relative to each species' asymptotic size) (η) at the end of the simulation (6,000 years). Each dot shows the predicted means and 95% confidence intervals from the 3‐way ANOVA model for each species, predation and fisheries combination. Data points show weighted average η for each species (across 10–50 phenotypes, see Figure S10 for the number of phenotypes per species) where each light gray point is a replicated simulation (10 simulations for each combination of fisheries and predation scenarios). The dashed line indicates the initial relative maturation size value (η)
